
Mercator Ocean International (MOi) oceanographers examine marine heatwaves across the global ocean. They analyse a variety of datasets from observations (satellite sea surface temperature maps) to numerical model analyses (assimilating satellite and in situ observations) and derive marine heatwave forecasts for a 7 day period.[1]
Forecasts for September 21st
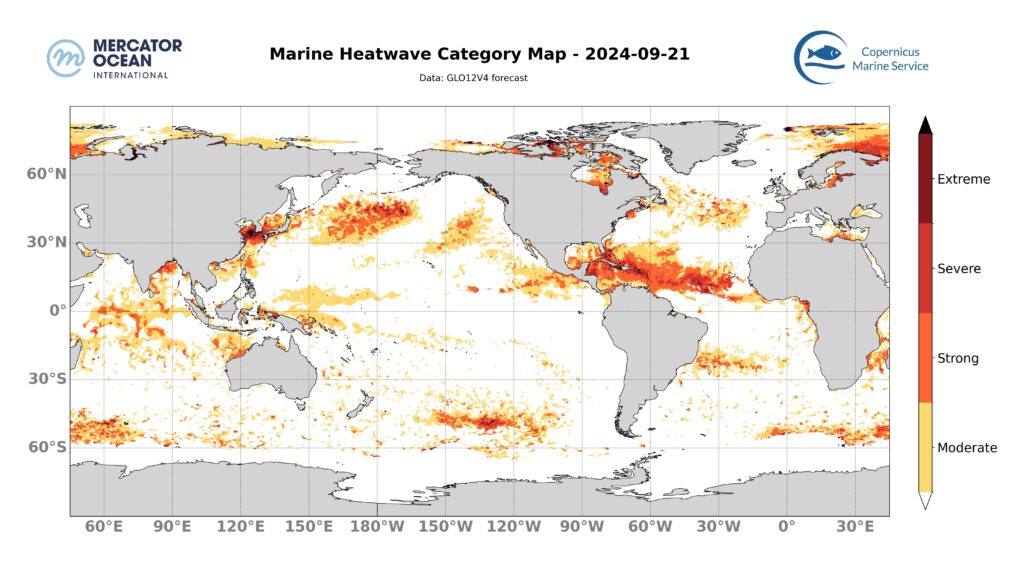
Europe Zone
For the 21th of september, Mercator Ocean International forecasts a quasi-disappearance of the marine heatwave in the Mediterranean Sea. Only moderate and strong categories persist along the coasts of Egypt and Libya.
In the southern part of the Baltic Sea, the marine heatwave is intensifying, with a progression from moderate to strong categories along the coasts of Poland to Estonia.
In the Norwegian Sea, the marine heatwave remains stable overall, with moderate and strong categories.
In the Barents Sea, marine heatwaves are increasing in intensity, with more areas in strong and severe categories.
Global Ocean
Atlantic Ocean
North Atlantic Ocean – MOi forecasts that the marine heatwave in the mid North Atlantic is decreasing both in extent and intensity, and is now in the moderate category overall.
North Tropical Atlantic Ocean – In the tropical North Atlantic, the marine heatwave in the middle of the basin (from Cuba to 30°W) is increasing in intensity and extent, and is now mainly in the strong category, with severe and extreme categories in local areas.
South Tropical Atlantic Ocean – In the Southern Tropical Atlantic, the marine heatwave still decreases in extent, we’re still observing mainly moderate categories.
Southern Ocean
The marine heatwave in the Southern Ocean, off the South African coast (between 30°W and 30°E) remains stable.
Pacific Ocean
Tropical Pacific Ocean – In the Tropical Pacific, the marine heatwave to the north of Papua New Guinea continues to shrink in size, until it almost disappears.
Off the coast of Mexico, the marine heatwave is increasing in extent, but still remains in moderate and strong categories.
The marine heatwave in the Gulf of California has disappeared.
North Pacific Ocean – In the North Pacific, the marine heatwave in the center of the basin, at around 180°W, remains stable overall, with moderate and strong categories.
Off the North American coast and around 150°W, marine heatwaves are decreasing in intensity, and are now mainly in moderate categories.
Marine heatwaves in the Sea of Japan and East China Sea continue to increase in intensity, with strong, severe and locally extreme categories in the Yellow Sea.
South-East Asian Seas – There are no more marine heatwaves in the Southeast Asian seas.
South Pacific, to the east of New-Zealand – The marine the heatwave is increasing in intensity, with more severe categories and, locally, more severe and extreme categories.
Indian Ocean
In the Indian Ocean, Mercator Ocean forecasts that the intensity and extent of the marine heatwave continues to decrease. There are mostly moderate categories and a few strong categories in the center of the basin.
Weekly temperature anomalies
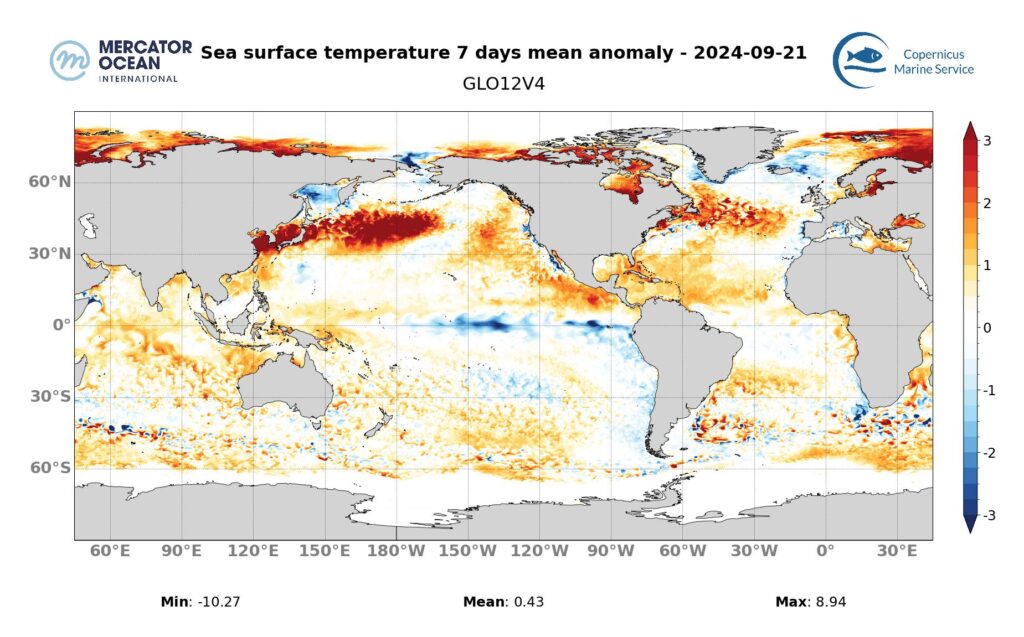
| Atlantic Ocean | North 1.5°C to 3°C | North Tropical 0°C to 1.5°C | South Tropical 0°C to 1°C | |
| Southern Ocean | 0°C to 2°C | |||
| Pacific Ocean | North 0°C to 3°C | Tropical -2°C to 2.5°C | South 0.5°C to 1.5°C | South-East Asian Seas 0°C to 0.5°C |
| Indian Ocean | 0.5°C to 2°C |
Consult our Daily Global Physical Bulletin for a 9-day forecast here.
What are marine heatwaves?
Marine heatwaves (MHW) are extreme rises in ocean temperature for an extended period of time. They can occur at different locations in the ocean, and their magnitude and frequency have increased over the last couple of decades, with harmful impacts on ecosystems, and human activities. According to the latest report released by the Intergovernmental Panel on Climate Change (IPCC AR6 SYR), it is found with high confidence that in the near-term at 1.5°C global warming, the increasing frequency of marine heatwaves will increase risks of biodiversity loss in the oceans, including from mass mortality events.[2]
How are marine heatwaves calculated?
A marine heatwave is an episode during which the ocean temperature is abnormally warm for at least 5 consecutive days.
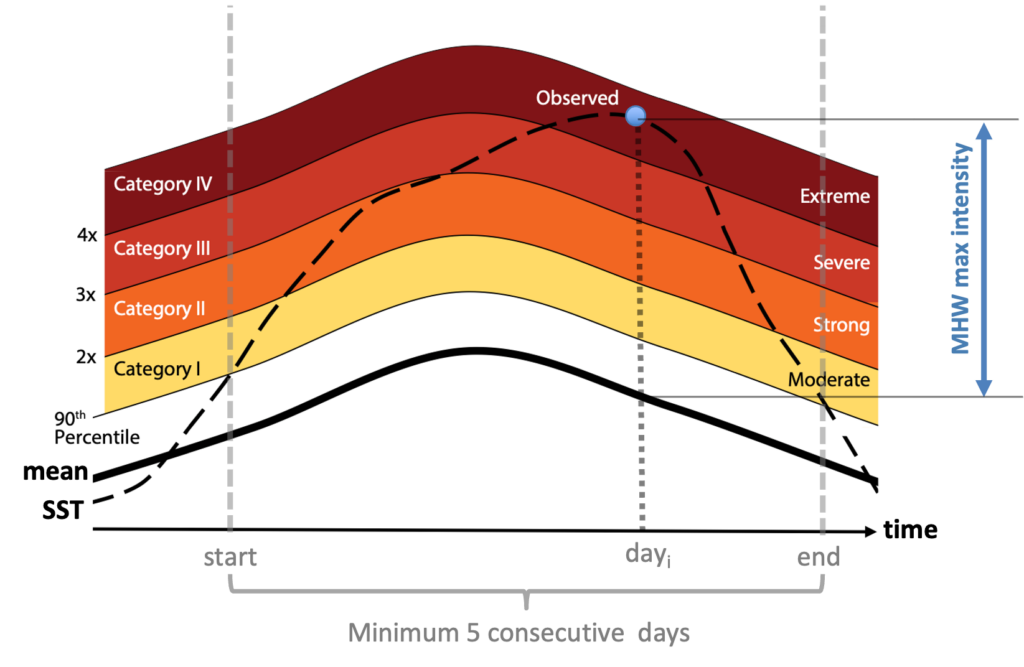
Figure adapted from Hobday et al. (2018)
For any location in the ocean, the normal temperatures are defined for every day of the year using a climatological period (here 1993–2016). A heatwave is identified when the measured daily temperature is within the top 10% of the highest recorded values for that day (i.e., above the 90th percentile, see diagram), and with this condition persisting for at least five consecutive days.
The intensity of the heatwave on any given day is measured as the number of degrees above the climatological average (represented by the bold black line) indicated by the blue arrow. We can either calculate the cumulative intensity over the entire heatwave or record the maximum intensity.
Heatwaves are classified based on their intensity level. To do this, the intensity is compared to the difference between the climatological value and the 90th percentile value. A mhw intensity between 1 and 2 times this difference corresponds to a heatwave of moderate category; between 2 and 3 times, to a strong category; between 3 and 4 times, to a severe category; and a difference greater than 4 times corresponds to an extreme category.
[1] Analysis of datasets: SST OSTIA (Copernicus Marine Service), OISST (NOAA), GLO12 (Copernicus Marine Service / Mercator Ocean International), PSY4 (Copernicus Marine Service / Mercator Ocean International), and GLO12 et PSY4 forecasts.
[2] IPCC AR6 SYR chapter 4.3 https://www.ipcc.ch/report/ar6/syr/downloads/report/IPCC_AR6_SYR_LongerReport.pdf