Sea Surface Temperature
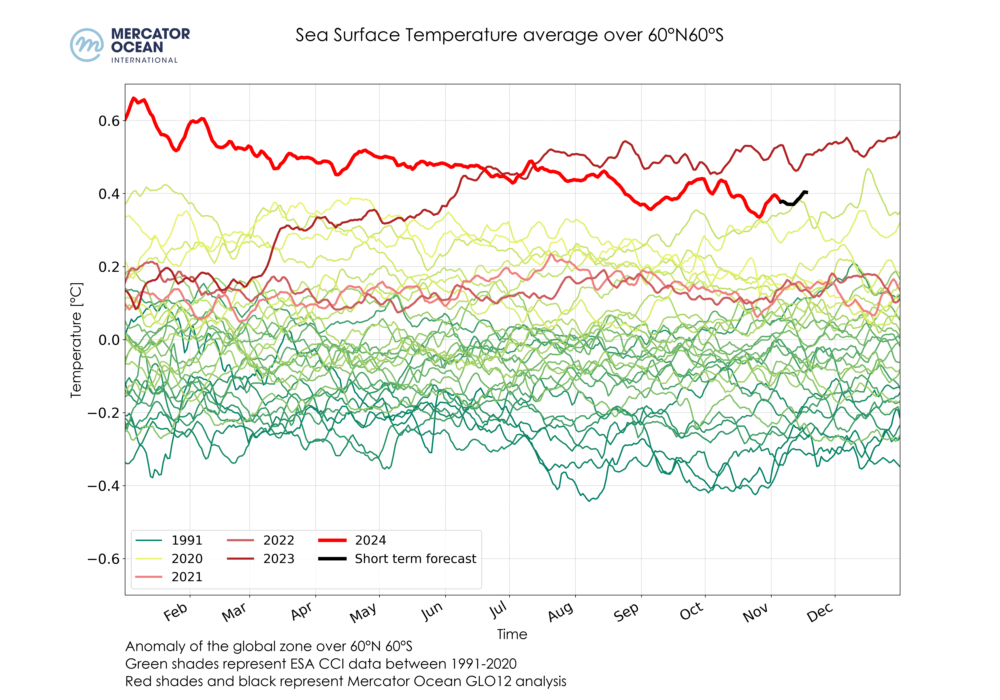
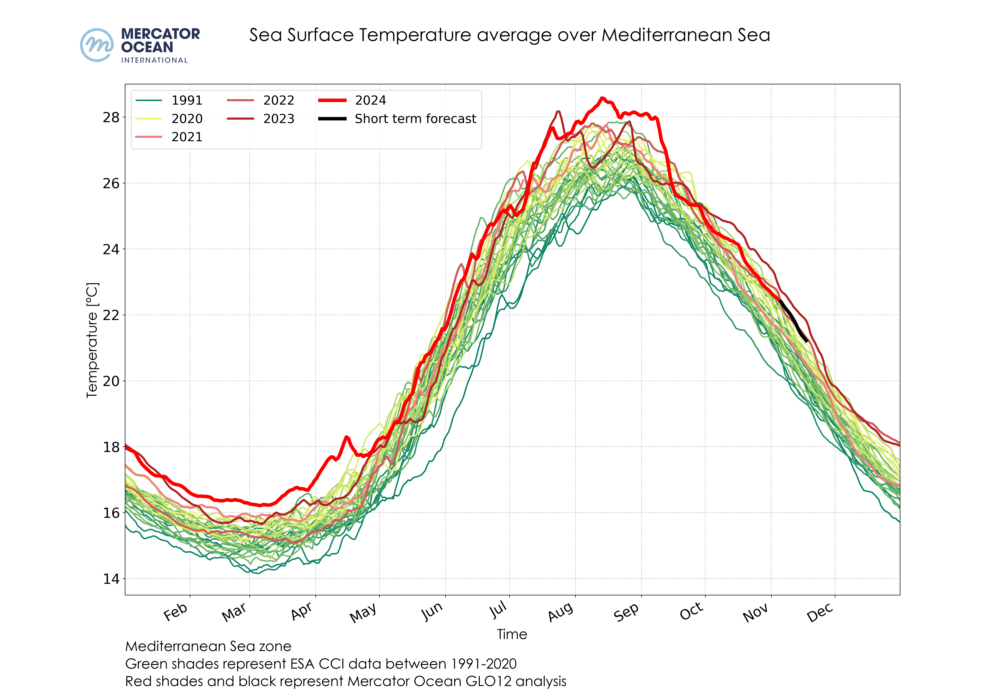
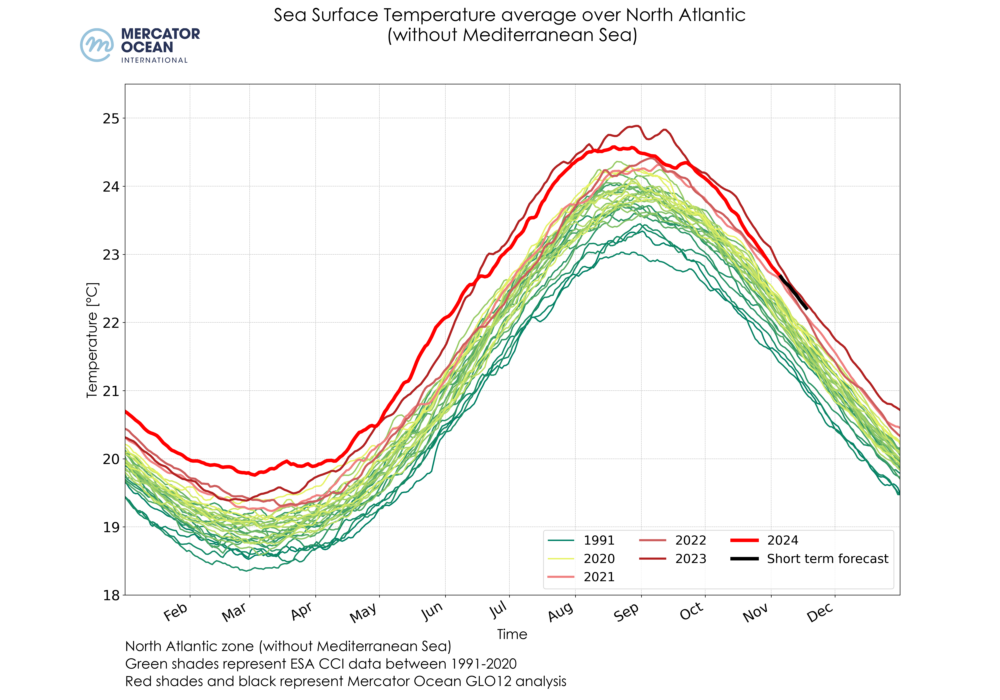
Sea surface temperature averaged for thethe global ocean (top), the Mediterranean Sea (bottom left) and the North Atlantic Ocean (bottom right) between 1991-2020 using ESA Climate Change Initiative (green shades), and between 2021-2024 (red shades) + forecast (black) using MOi GLO12 analysis.
- October 2024 was the 2nd warmest on records (after 2023) with a mean temperature of 20.8 ºC in the global ocean.
- In the Mediterranean Sea, also the 2nd warmest month (after 2023), with a mean of 23.8ºC.
- For the North Atlantic region, the mean temperature reached 23.5°C, making it the 4th warmest October (after 2023, 2012 and 2019).
Sea Surface Temperature Anomalies
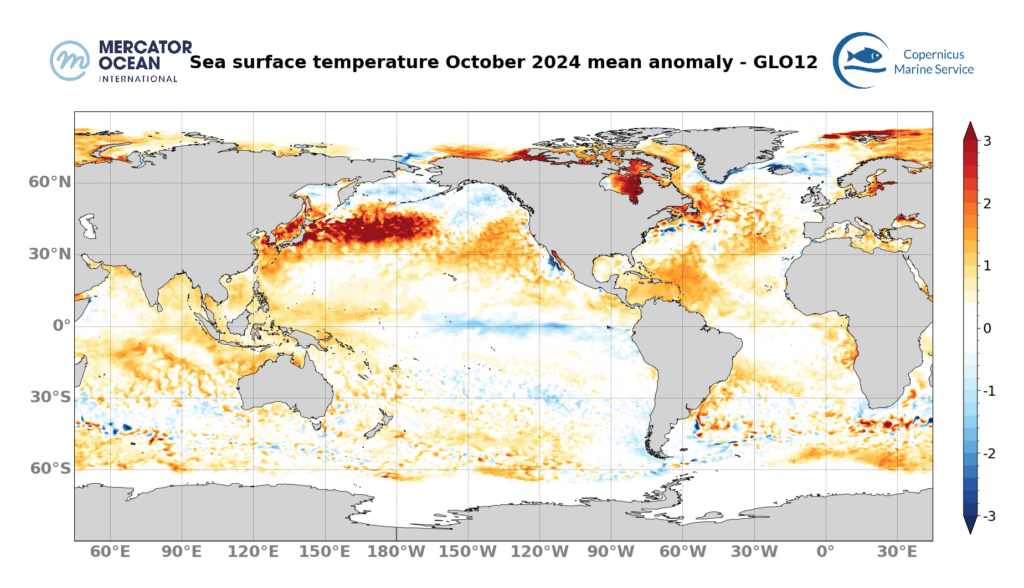
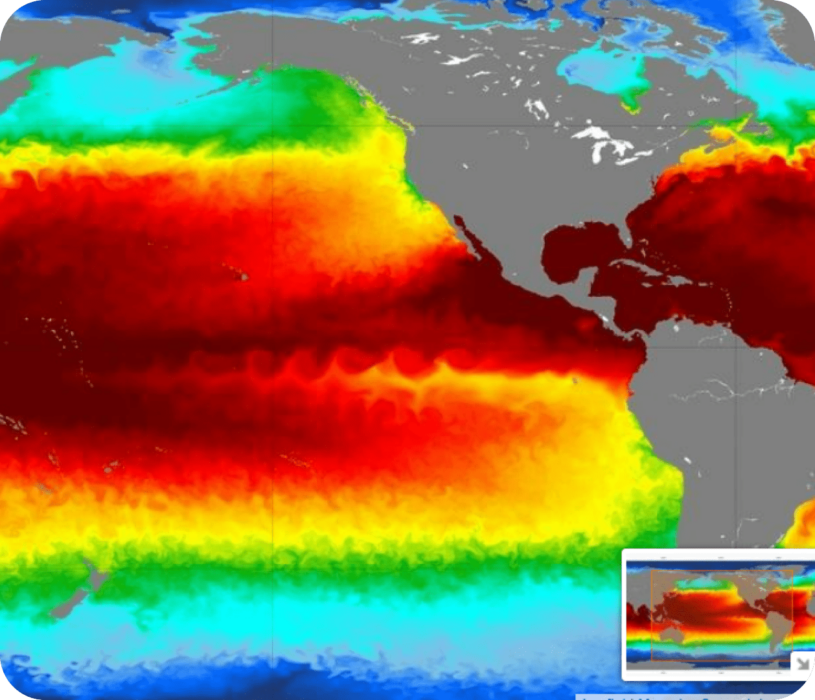
- Mean sea surface temperature anomalies for October were close to 1°C in the North Atlantic, Caribbean Seas, North East Pacific and South East Asia regions.
- Highest anomalies reaching 3°C occurred in the Kuroshio region and its extension across the pacific. Note that also a negative anomaly is present at the equator on the East of the Pacific basin; such cold anomaly is linked to the small ongoing Niña event.
Ongoing marine heatwaves: 31 October 2024
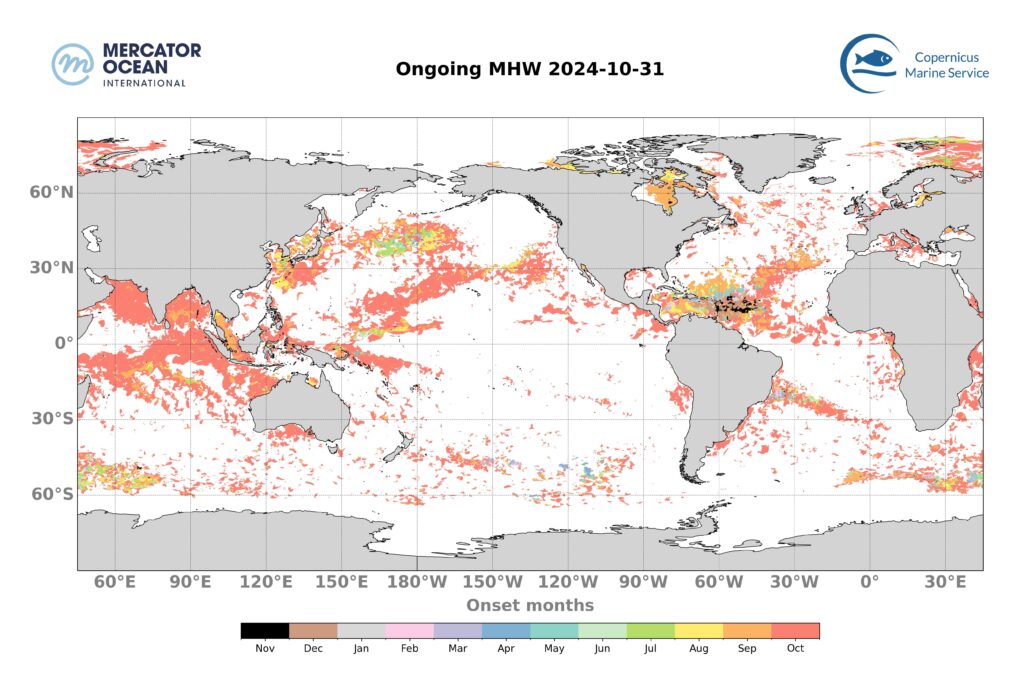
Long warming events may induce important stress on marine ecosystems. In this section is shown the ongoing marine heatwave events on October 31, 2024, and when those have initiated.
25.3 % of the global ocean (between 60°S and 60°N) were affected by MHWs on the 31st of October.
The majority of these MHWs developed recently, with 17% of the global Ocean (between 60°S and 60°N) affected by MHWs less than 1 month old, and 3% by events between 1- and 2-month-old.
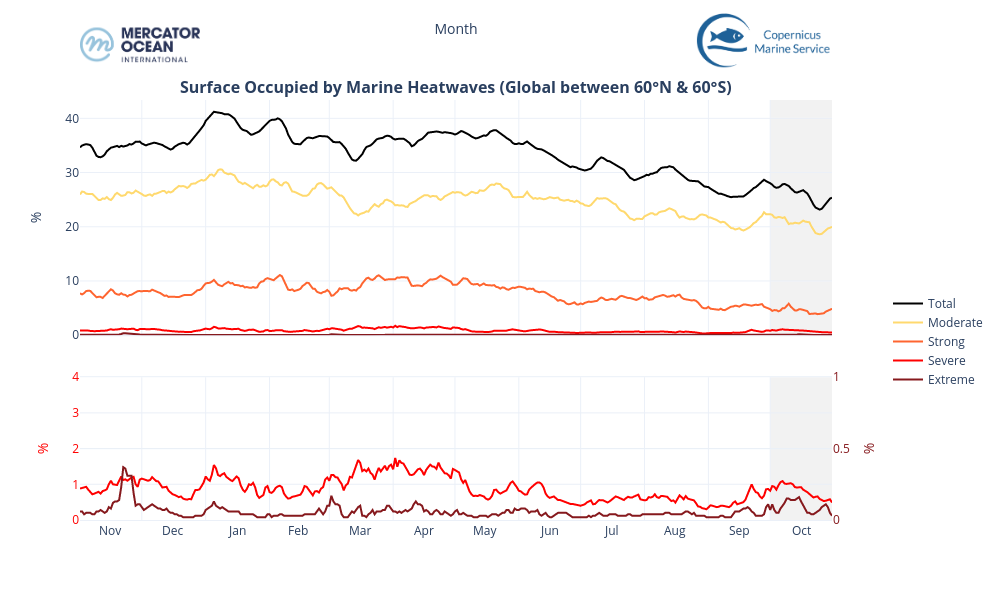
Total surface exposed to marine heatwaves (November 2023-October 2024)
- The total surface for October 2024 continued a decreasing trend, reaching the lowest level mid-October (22.5%) – highlited in grey int he graph below.
- By the end of October, the extent reached 25.3 % of the global ocean. In comparison with 2023, the lowest MHW extent was reached earlier in the year in July (~27%) and progressively increased to 30-35% during October, and peaked in early January 2024 (42%).
- The maximum surface of marine heatwaves occurs during January and February, during summer season in the southern hemisphere (period of higher marine heatwave occurence), which in turn contains a larger proportion of ocean than its northern counterpart.
- The reduction in total surface can be explained by a predominant drop of strong and severe marine heatwaves (in orange and red). In contrast, moderate categories have remained stable over the month (in yellow).
Global Ocean
European Zone
Total number of marine heatwave days for October 2024
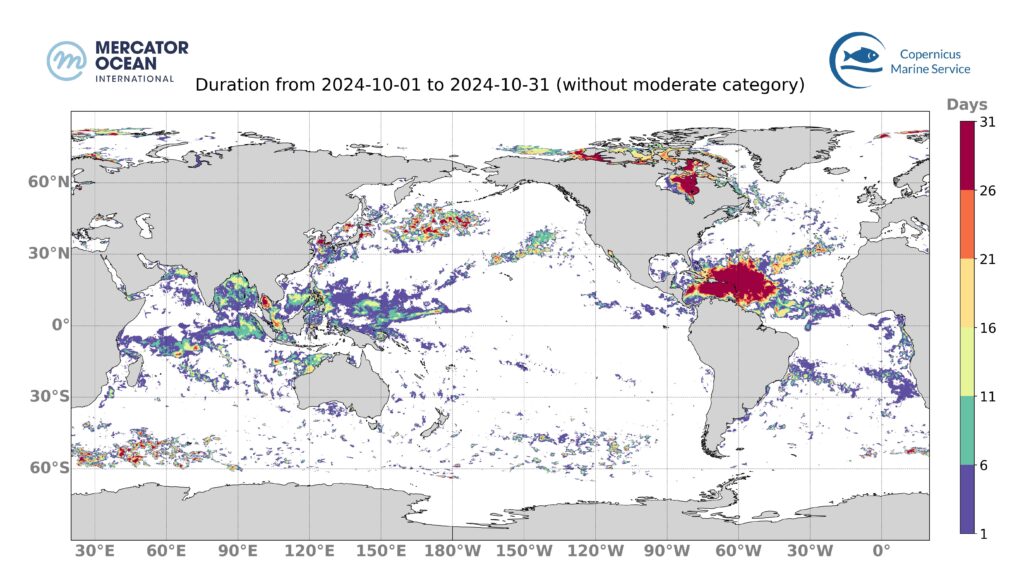
The surface of the ocean impacted by strong or higher MHW conditions for at least 1 day is 20.71 %.
The impacted regions are mainly the Caribbean Sea, the south east Asia region and the North Pacific.
The surface of the ocean covered by strong or higher MHW conditions during the entire month is close to 1%. This takes place in the Caribbean region.
October month statistics
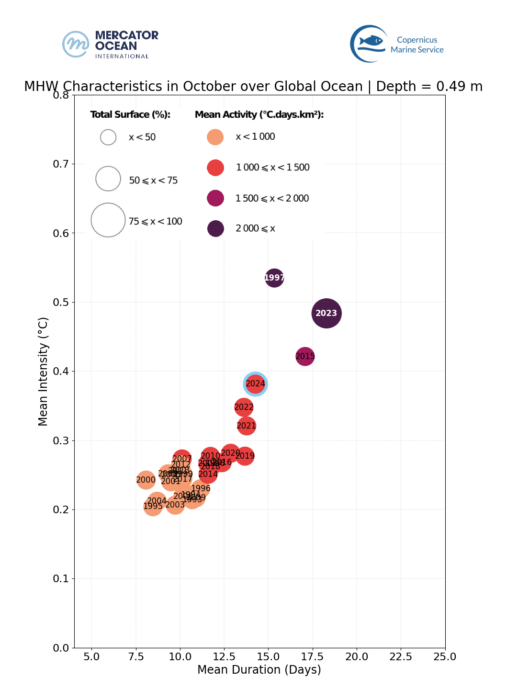
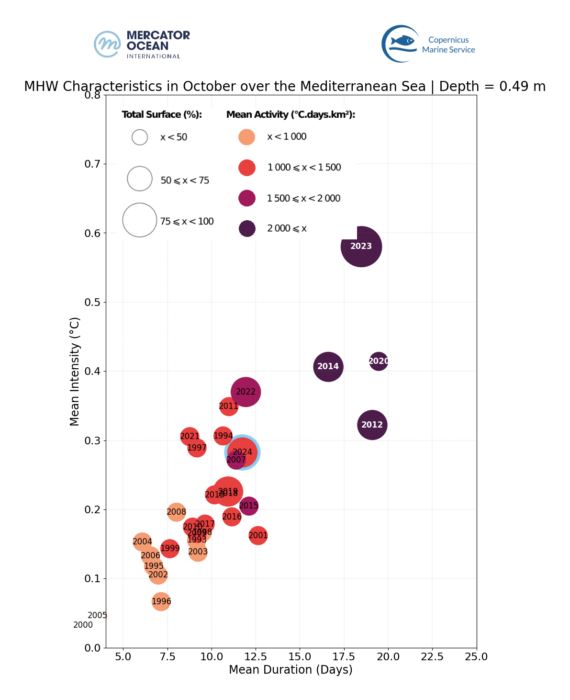
Mean duration and intensity of marine heatwaves in October months between 1993 and 2024 for the global ocean (left), for the North Atlantic Ocean (center) and the Mediterranean Sea (right). Satelite measurements were obtained for the 0.49 m ocean surface layer.
The MHW statistics (MHW duration, intensity, surface occupied and frequency) for October 2024 are compared to those of Octobers from previous years (since 1993).
- At global level, October 2024 was the 4th most extreme October month (After 1997, 2015, 2023 which are all “Niño years”).
- In the Mediterranean Sea we observe that October 2024 appears as a moderate month compared to other years. For example, October 2024 is weaker than October 2012, 2014, 2020 and 2023.
- In the North Atlantic, October 2024 was the 2nd most extreme October month, only October 2023 was more extreme.
About the bulletin
Mercator Ocean International (MOi) publishes a monthly surface temperature bulletin reporting on mean temperature and marine heatwave conditions for the month just passed. It includes:
- Mean temperatures for the global ocean, the North Atlantic and the Mediterranean Sea together with anomalies.
- for regions of the ocean in marine heatwaves situation the time this event started,
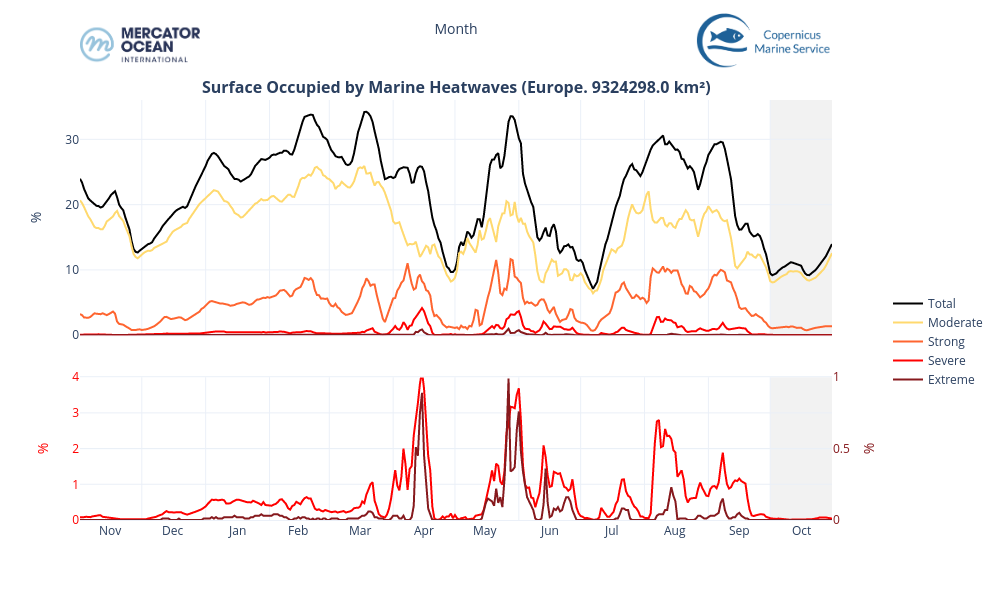
- the timeseries showing the total surface occupied by marine heatwaves globally and for the European region,
- and the total number of days of exposure to marine heatwave during the month (including only strong and higher intensity categories).
The results are obtained using the Copernicus Marine Service global analysis system.
*Image citation: European Union, Copernicus Marine Service Data 2024 I © Mercator Ocean
All images in this article can be used freely and should be cited with the information above.

