A recap of the main highlights of the year for sea surface temperature, marine heatwave events and sea ice extent and volume.
Ocean Temperature
- 2024 was the warmest year on record for the ocean – both on a global and regional scale. 20.95°C was the annual mean temperature for the global ocean.
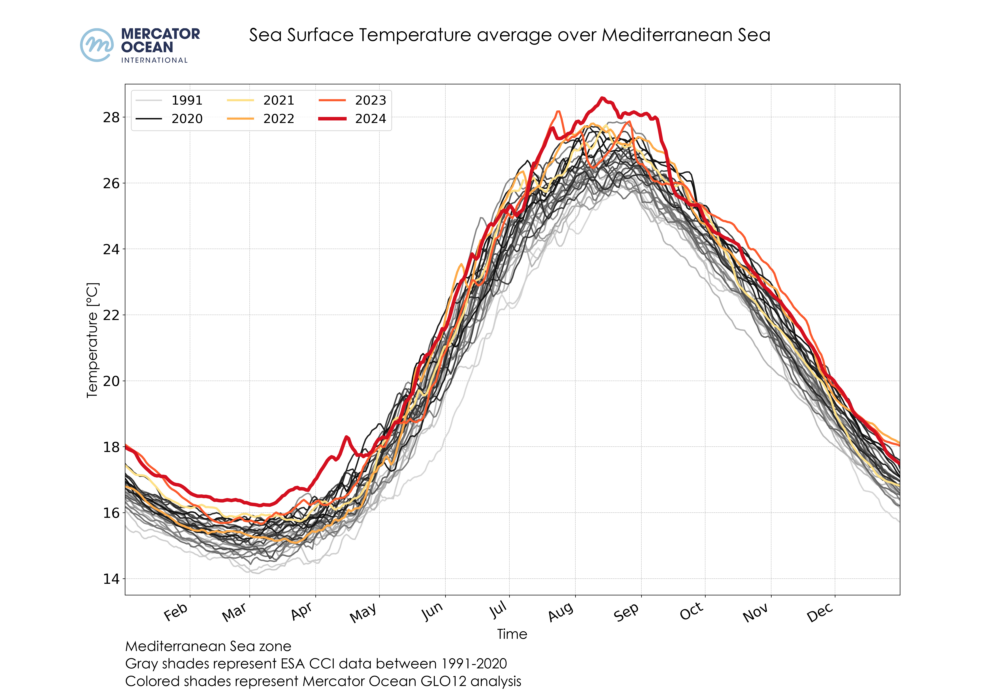
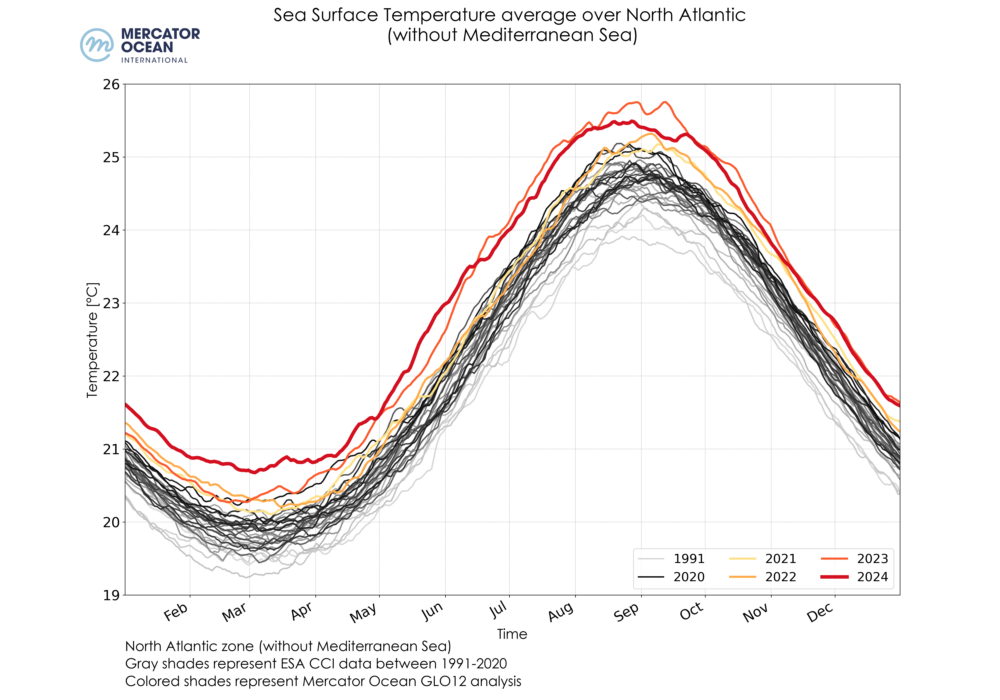
- In the European zone, the North Atlantic Ocean (0°-60°N) and the Mediterranean Sea experienced the highest sea surface temperatures on record, with mean values reaching 22.91°C and 21.40°C.
- Mean sea surface temperature anomalies were the highest along the Kuroshio, in the western north Pacific Ocean, with values above +2°C.
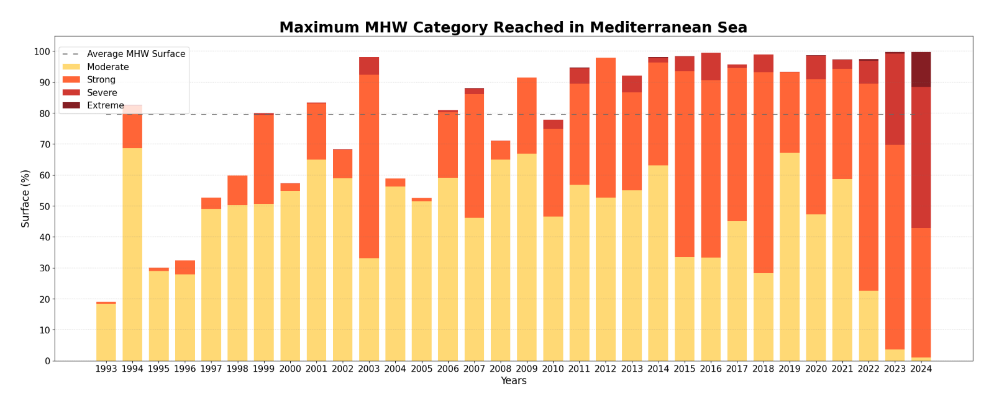
- Nearly the entire Mediterranean Sea experienced at least one marine heatwave event during 2024 (99.8%) –following the same wide distribution observed in 2023.
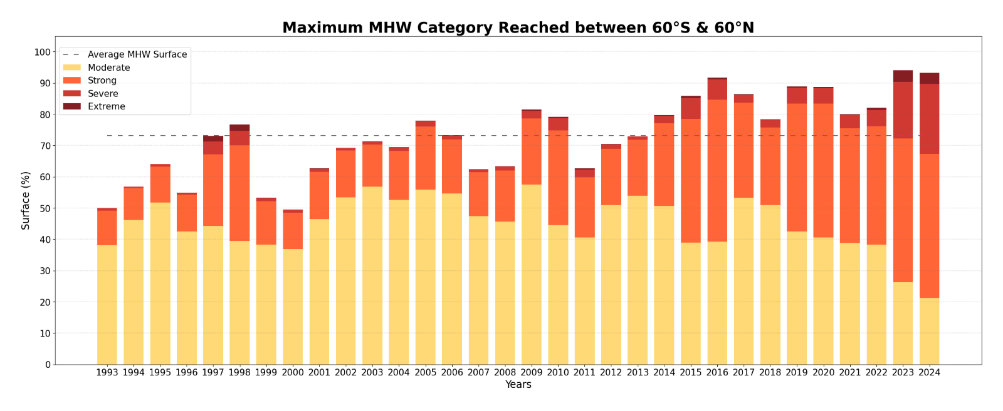
- 93% of the global ocean experienced a marine heatwave event – the second widest extent after the 2023 record – while 72% reached strong or higher intensities.
Sea Surface Temperature
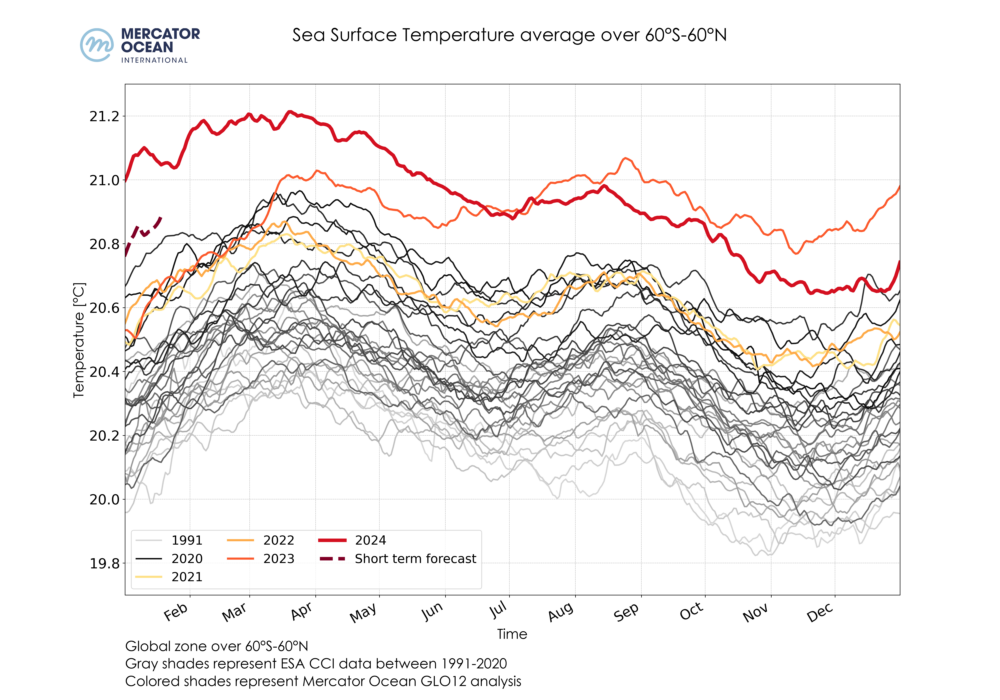
Figure 1. Daily sea surface temperatures averaged for the global ocean between 1991-2020 using ESA’s Climate Change Initiative (grey shades), and between 2021-2024 (coloured shades) using Mercator Ocean International’s GLO12 analysis. Credits: EU, Copernicus Marine Service/Mercator Ocean International.
The mean sea surface temperature (SST) across the global ocean was higher than any previous year from January to July 2024, resulting in an annual mean of 20.95°C – 0.06°C above the previous record in 2023. Note that from July 2023 to July 2024, the global ocean experienced a continuous period of record high temperatures resulting in a mean SST of 21.00°C.
Credits: EU, Copernicus Marine Service/Mercator Ocean International.
Regionally, 2024 registered the highest SST on records in the Mediterranean Sea and in the North Atlantic Ocean (0°-60°N), with mean values of 21.40°C and 22.91°C respectively (0.32°C and 0.6°C above previous record in 2023).
Sea Surface Temperature Anomalies
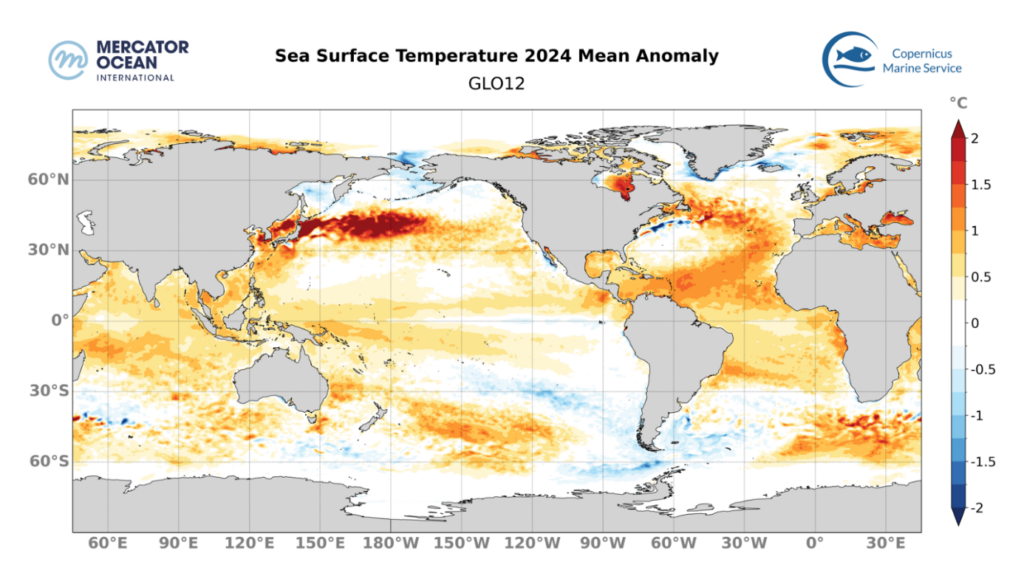
Figure 3. 2024 Mean SST Anomaly relative to a 30-year climatology (1993-2022), calculated using daily data from Mercator Ocean International’s GLO12 analysis for 2024 and from GLORYS12 reanalysis for the climatological mean. Credits: EU, Copernicus Marine Service/Mercator Ocean International.
In 2024, 85.7% of the global ocean exhibits a positive annual mean SST anomaly, indicating warmer-than-average conditions on an annual scale.The highest mean sea surface temperature anomalies occurred in the Kuroshio region and its extension in the Pacific, with a large area above 2°C.In the Mediterranean Sea, in the North Tropical Atlantic, off south Africa and in the southwest Pacific SST anomalies reached 1.5°C.In the upper South Atlantic, in the Indian Ocean and in the Southeast Asia regions, mean SST anomalies ranged between 0.5°C and 1°C. Negative anomalies were found in the South Pacific (between -0.5°C and -1°C) and in the Eastern Tropical Pacific (~ -0.5°C).
Ranking 2024 Sea Surface Temperature Anomalies
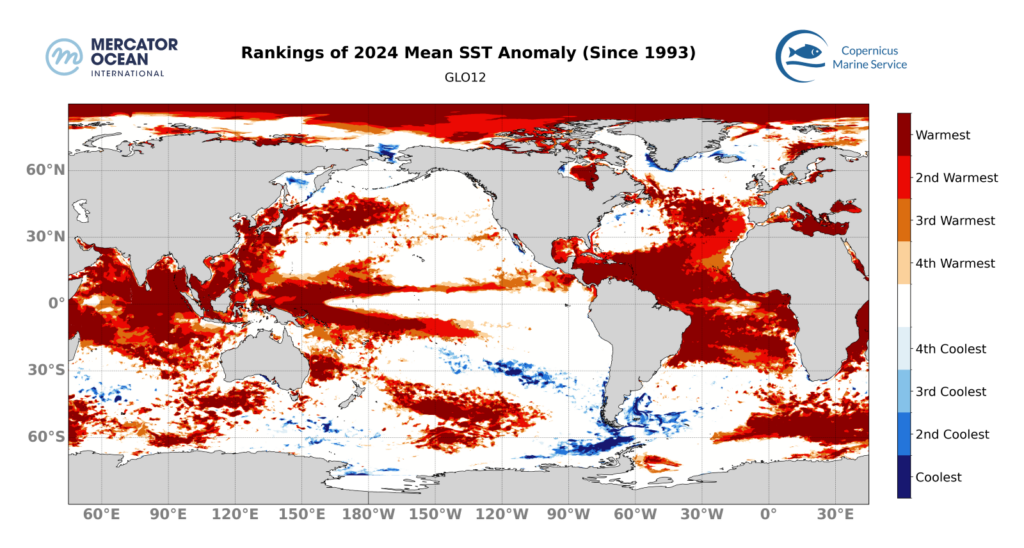
2024 was the warmest year since 1993 for 25% of the global ocean, with the Tropical Atlantic Ocean, the Mediterranean Sea, the part of the Southern Ocean south of South Africa, the Indian Ocean and the Western Pacific being the most affected regions. More generally 2024 was amongstthe 4 warmest years for 51% of the global ocean (between 60°S and 60°N).The Tropical Atlantic Ocean, the Mediterranean Sea, the Southern Ocean south of South Africa, the Indian Ocean and the Western Pacific were the most affected regions.
In contrast, less than 2.5% of the global ocean ranked among the 4 coolest years, mainly in the Pacific, Atlantic and Southern Ocean around the south of South America regions. Record temperatures were reached in 67% of theMediterranean Sea and in41% ofthe North Atlantic Ocean (between 0°N and 60°N). More generally, for these regions, 2024 was among the 4 warmest years on records for 91% and 70% respectively.
EL Niño Southern Oscillation
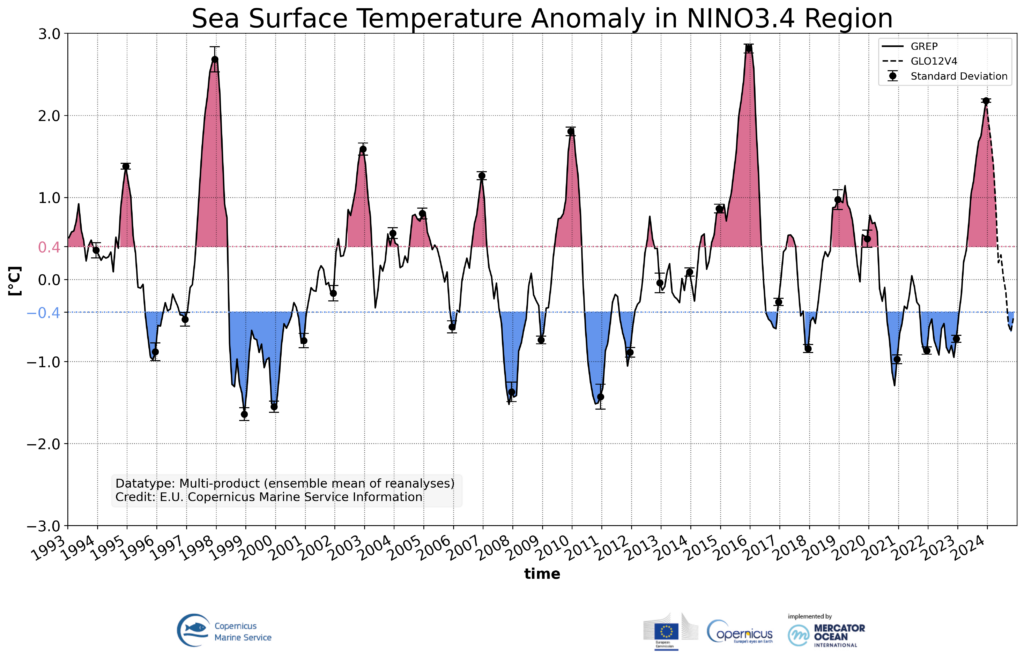
2024 saw the end of the El Niño event – a naturally occurring climate phenomenon characterized by the warming of sea surface temperatures in the central and eastern equatorial Pacific Ocean. The event that started during the boreal summer of 2023 and peaked in December, died off in spring 2024 to transition into a neutral state with moderately negative anomalies since July 2024 over the Nino3.4 region, used here as index for monitoring the El Niño Southern Oscillation (ENSO).
The ENSO index is calculated from the sea surface temperature over the Nino3.4 region (ranging from Lat -5° to 5° and Lon -170° to -120°) in the Pacific Ocean using the Copernicus marine GREP ensemble of reanalyses for the period 1993-2023, and the global analysis system for the year 2024.
Marine heatwaves in 2024
The highest MHW categories
Marine heatwaves (MHWs) are abnormally warm events for which extreme temperatures are observed for at least 5 consecutive days; their occurrence and severity is monitored as MHWs when prolonged or very intense can have negative impact on the environment and ecosystems.
A MHW can be classified according to its intensity into 4 categories: moderate, strong, severe and extreme. Note that for some regions a further category was added `Beyond Extreme` for surpassing the original scale of intensity. The highest category reached in each region of the global ocean in 2024 is represented in the map below. The highest categories were detected in the Southern Ocean (south of South Africa), in the Tropical Atlantic Ocean and in the Mediterranean Sea.
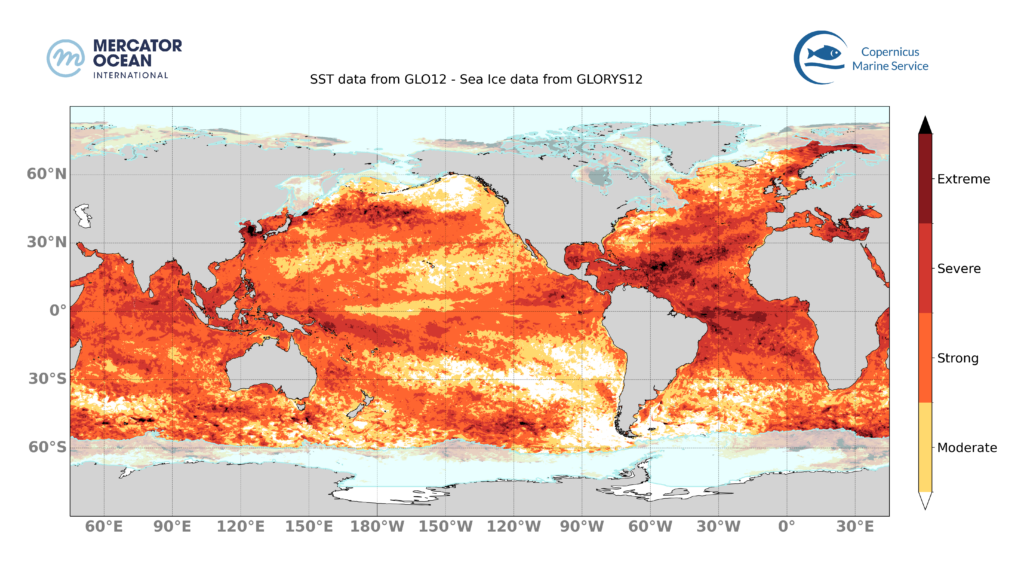
Figure 6. The highest MHW Category reached in 2024. Blank areas mean that no MHW occurred in these regions in 2024. Blue shaded areas in the polar regions represent the sea ice maximum from the climatological period (1993-2022). Monitoring SST extremes with the MHW categorization approach as used here is not best suited for such regions. Credits: EU, Copernicus Marine Service/Mercator Ocean International.
Ranking the most intense marine heatwaves
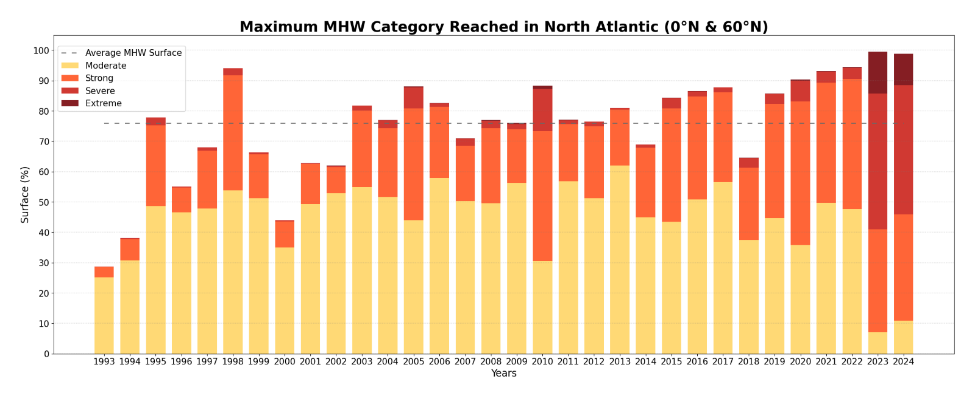
The geographical extent of the highest category reached in 2024 was compared to the highest categories reached each year since 1993 for the global ocean (between 60°S and 60°N), the Mediterranean Sea and the North Atlantic.
Global Ocean (between 60°S and 60°N)
- 93.2% of the global ocean was affected by MHW during the year 2024. It is the second largest extent impacted by MHW after 2023 (94.1 %).
- 72% of the global ocean was affected by a MHW of strong or higher category, which is higher than any previous year (previous record in 2023 with 67.8%).
Mediterranean Sea
- Nearly the entire Mediterranean Sea (99.8%) was affected by MHW during the year 2024. This corresponds to the first largest extent impacted by MHWs, an extent slightly higher than 2023.
- 98.7% of the basin was affected by a MHW of strong or higher category, which is higher than any previous year (previous record in 2023 with 96.1%).
North Atlantic (between 0°N and 60°N)
- 98.8% of the North Atlantic was affected by MHW during the year 2024. It is the second widest extent impacted by MHW after 2023 (99.6 %).
- 87.9% was affected by a MHW of strong or higher category, which is the second highest extent since 1993 (after 2023 with 92.4%).
SEA ICE
Global Sea Ice
- 2024 saw the continuation of a drastic loss of sea ice at global scale – caused by a combination of the major melting occurring during the northern hemisphere spring in the Arctic, and the significant lack of sea ice growth during the southern hemisphere autumn in the Antarctic, visible in the latest years.
- The global (northern and southern hemisphere) sea ice extent (SIE) was close to the 2023 historical record. From June to November, the years 2023 and 2024 competed to beat the lowest historical records.
- The global sea ice volume (SIV) reached a record-low in 2024.
Arctic Sea Ice
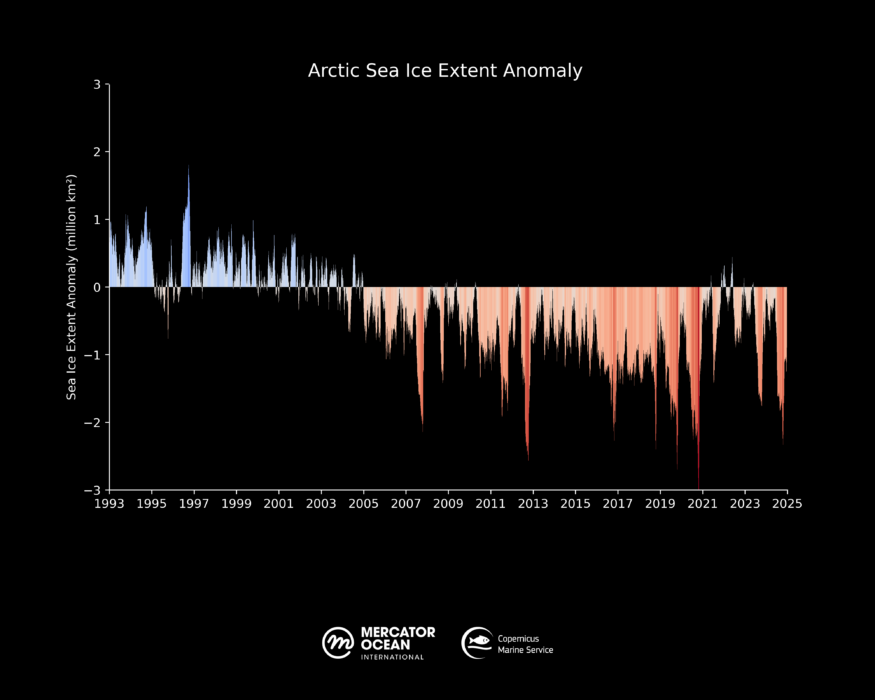
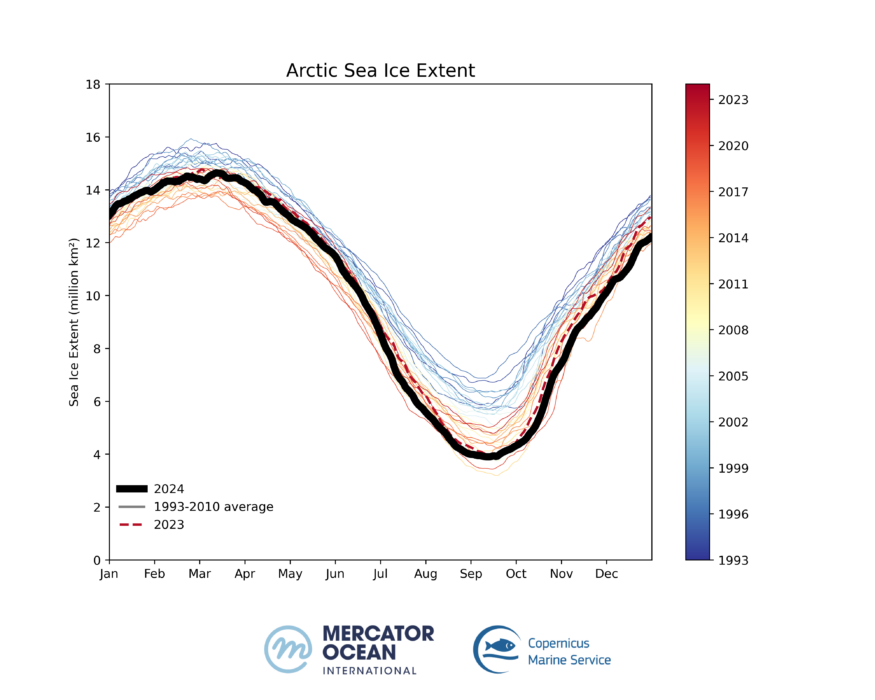
- Sea ice extent and volume in the northern hemisphere continued to follow a steady decline. 2024 ranked the 8th lowest sea ice extent for the northern hemisphere.
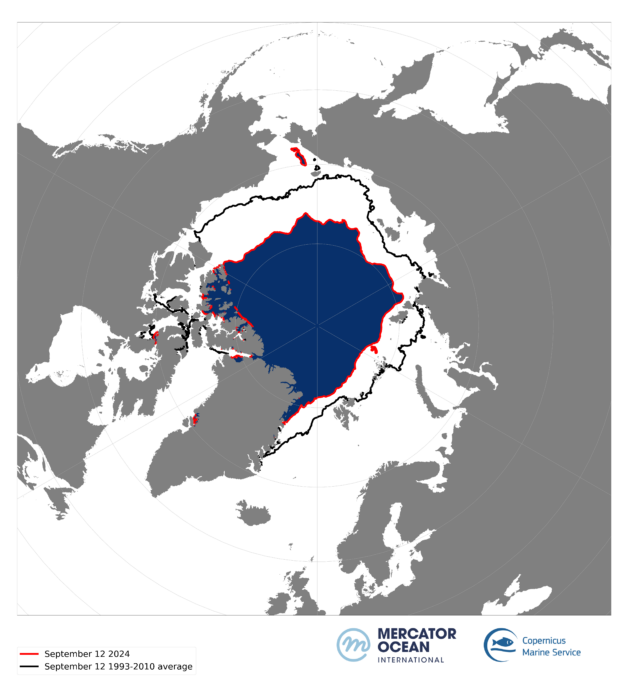
- September 2024 (period of minimum sea ice cover) was the 3rd lowest summer minimum sea ice extent recorded, following the historical records of 2012 and 2020. September 12th sea ice annual minimum extent registered 3.90 million km², representing a sea ice loss of 1.74 million km² or a 30% loss in sea ice compared to the long-term average 1993-2010 in the summer period.
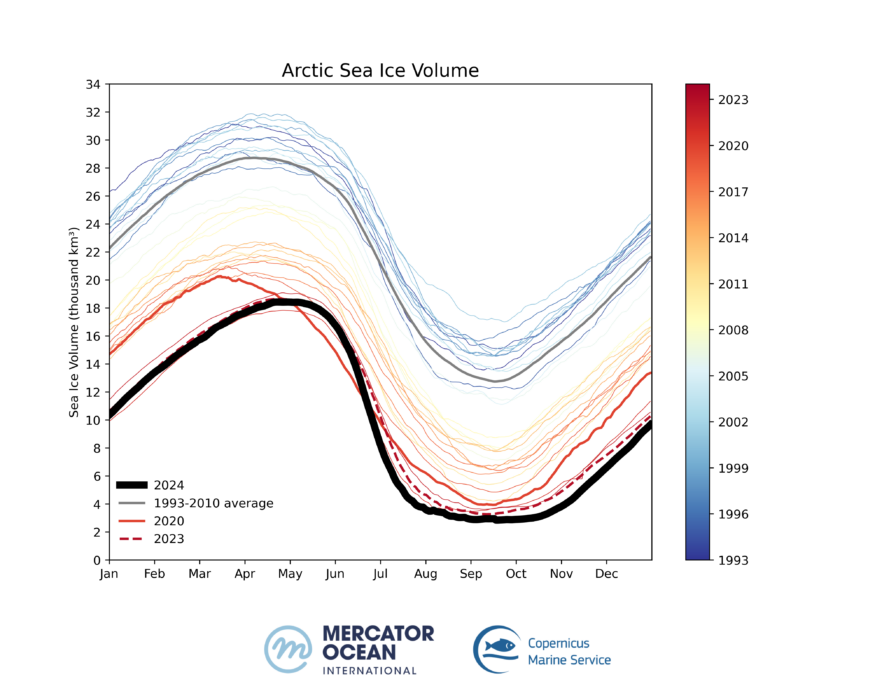
- Arctic sea ice volumes are at historically low levels during the summer and autumn periods.
- February 2024 (period of maximum sea ice cover) registered a loss of 45% in sea ice volume compared to the 1993-2010 average.
- September 2024 marked a record-low of sea ice volume with 2.84km3. A 77% sea ice loss compared to the long-term average 1993-2010 for this time of the year.
Annual Arctic Sea Ice Minimum Extent
Figure 8 (top): Arctic sea ice extent (red) for 12 September 2024. The black line represents the 1993-2010 average (climatology) for the same day of the year. Bottom: 1993-2024 Arctic Sea ice extent daily anomaly compared to 1993-2010 climatology. Credits: European Union, Copernicus Marine Service/Mercator Ocean International
Daily Arctic Sea Ice
1993-2024
Figure 9: The 1993-2024 Arctic daily sea ice extent (left) and volume (right). Credits: European Union, Copernicus Marine Service Data/Mercator Ocean International
Antarctic
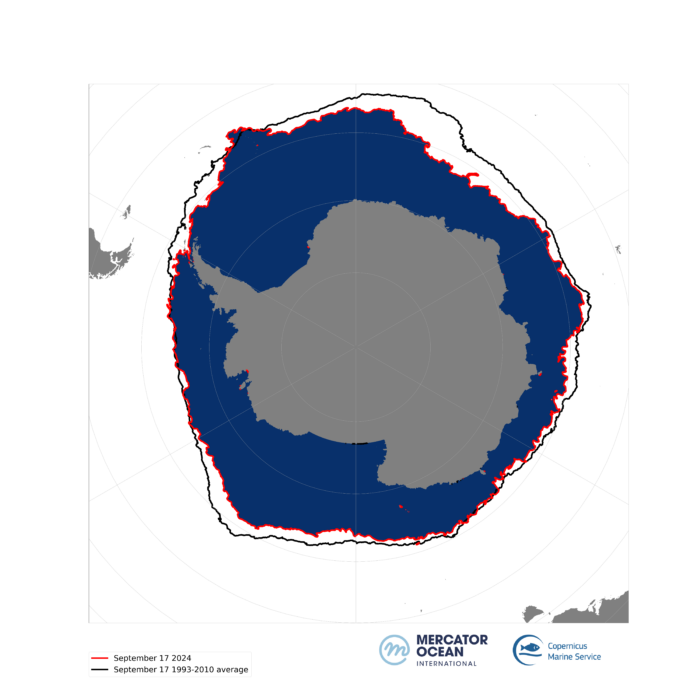
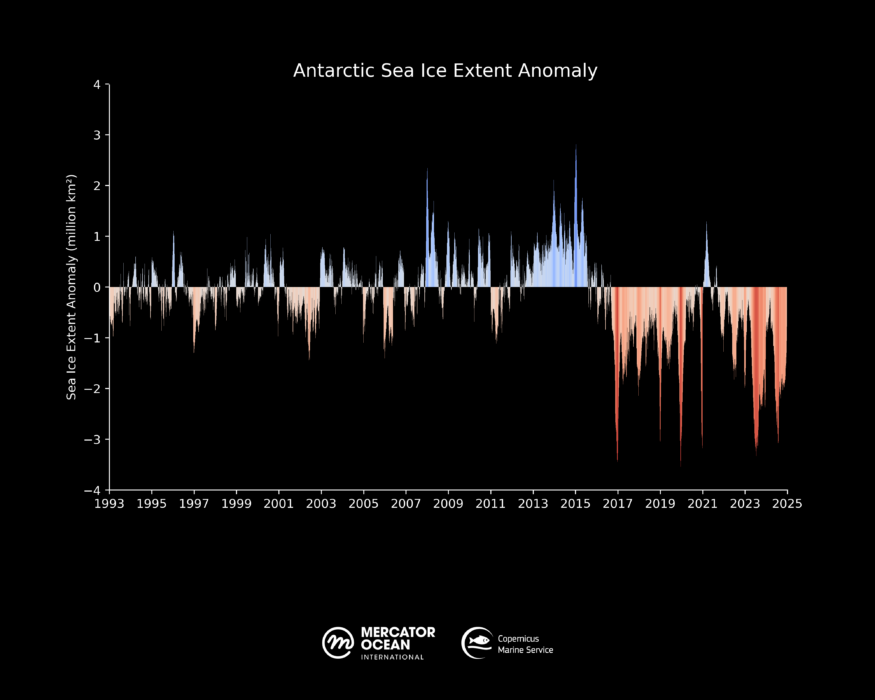
- In 2024, the Antarctic Sea ice extent annual maximum is the second lowest after 2023 – 1.76 million km2 and 9% less than the long-term average (1993-2010).
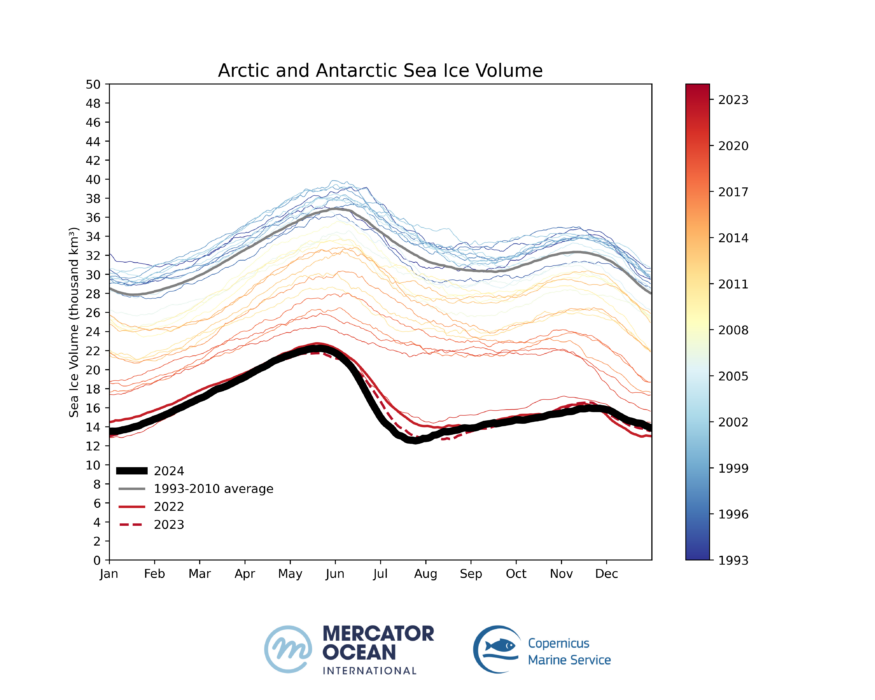
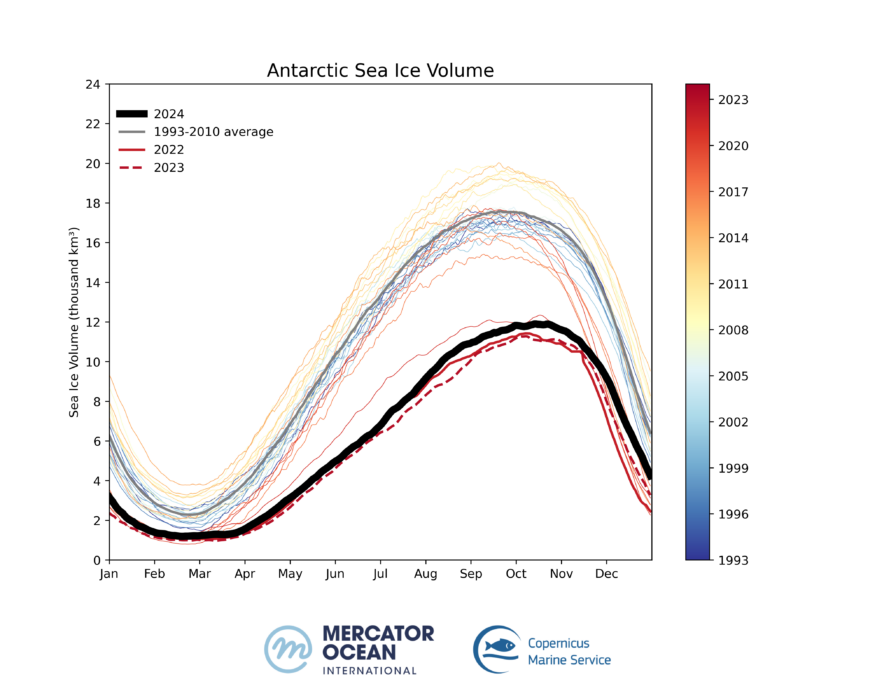
- Sea ice volume followed the 2022 and 2023 historical record-lows for September.
- 2024 reproduces the trend of the previous three years, with an exceptionally low volume of ice compared with the 1993-2010 baseline. 2024 ranked the 3rd lowest sea ice volume in the southern hemisphere since 1993.
Annual Antarctic Sea Ice Maximum Extent
Figure 10 Top: Antarctic sea ice extent (red) for 17 September 2024. The black line represents the 1993-2010 average (climatology) for the same day of the year. Bottom: 1993-2024 Antarctic Sea ice extent daily anomaly compared to 1993-2010 climatology. Credits: European Union, Copernicus Marine Service/Mercator Ocean International
Daily Sea Ice
1993-2024
Figure 11: The 1993-2024 Antarctic daily sea ice extent (left) and volume (right). Credits: European Union, Copernicus Marine Service Data/Mercator Ocean International
Datasets and products
Ocean Temperature
The results for the 2024 analysis were obtained using the Copernicus Marine Service global systems including the analysis and forecasting system together with the reanalysis product:
- Copernicus Marine Service global systems including the analysis and forecasting system:https://doi.org/10.48670/moi-00016
- Copernicus Marine Service global ocean eddy-resolving (1/12° horizontal resolution, 50 vertical levels) reanalysis covering the altimetry (1993 onward). https://doi.org/10.48670/moi-00021
Notes: The global analysis system was used to study the ocean surface temperature for 2024 and 2023. To study SST for previous years (1993 to 2022), it was used the reanalysis system. The reanalysis product was used for generating a daily climatology using the 30-year period from1993 to 2022.
Sea ice
For historical records: GLORYS12V1 global ocean eddy-resolving (1/12° horizontal resolution, 50 vertical levels) reanalysis covering the altimetry (1993 onward). https://doi.org/10.48670/moi-00021
For near real time records: The Operational Mercator global ocean analysis and forecast system at 1/12 degree. https://doi.org/10.48670/moi-00016
Notes:
- Sea Ice Extent – area covered by a significant amount of sea ice, at least 15% sea ice concentration (km²).
- Sea Ice Volume – a product of sea ice concentration and sea ice thickness integrated over a respective area (km3).
Image credits
All images can be used freely and should be cited as mentioned above.
Further reading
Sea Surface and Deeper Water Temperatures Reached a New Record High in 2024
Antarctic Sea Ice Reaches Lows Never Before Observed – Mercator Ocean (mercator-ocean.eu)


