
The marine heatwave bulletin provides forecasts and analysis of marine heatwave events across the globe and throughout the year. Used datasets include observations (satellite sea surface temperature maps) and numerical model analyses (assimilating satellite and in situ observations) to derive marine heatwave forecasts for a 10-day period. This week’s forecasts were produced using as a comparison the marine heatwave situation on 01/04/2025.
Forecasts for 12 April
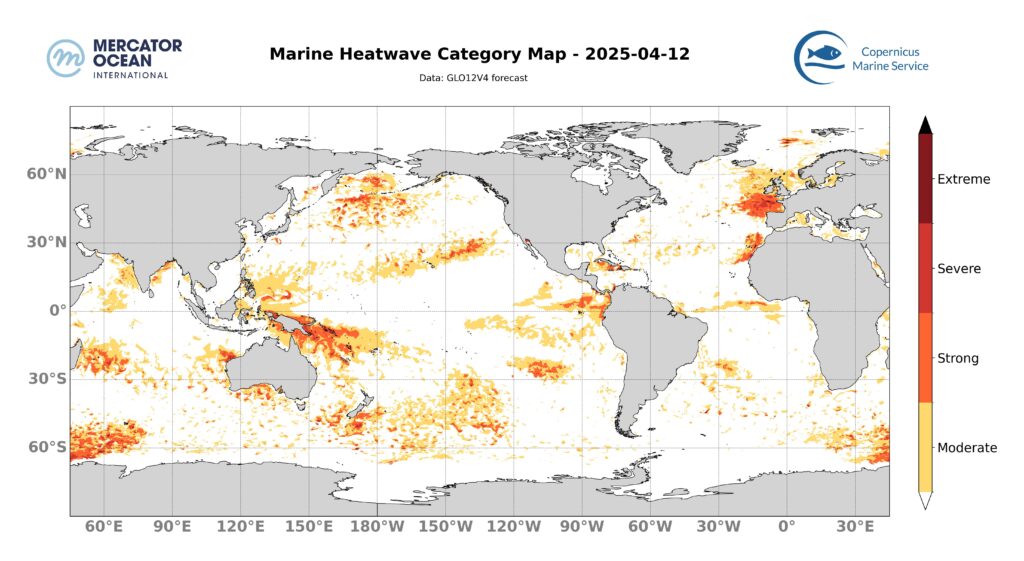
Tropical Atlantic Ocean
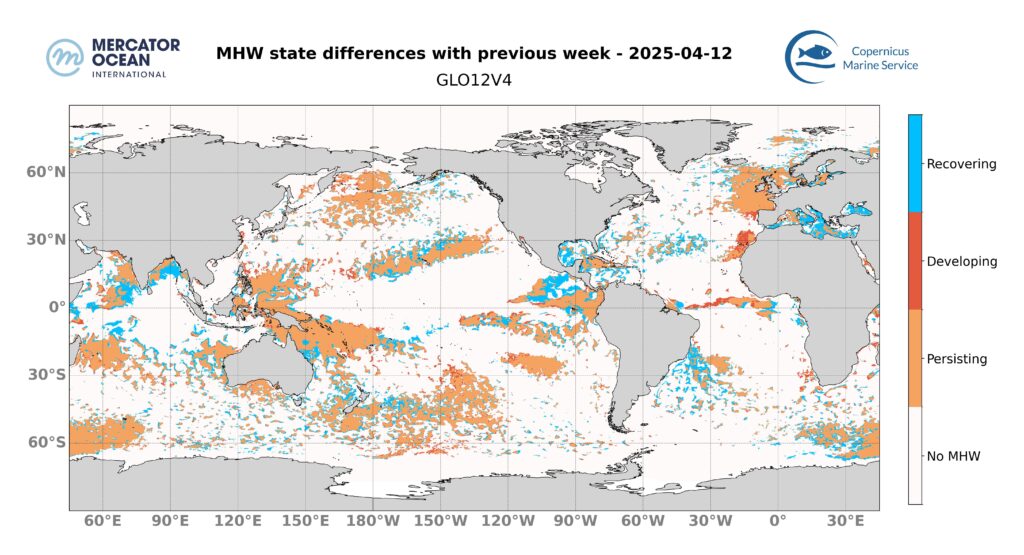
The marine heatwave in the Gulf of Mexico and the Caribbean Sea is diminishing in extent, and only a few scattered areas remain in moderate category, and locally strong off Cuba. Towards the equator, in the middle of the basin, a moderate to locally severe marine heatwave is developing. Off Brazil, the moderate-intensity marine heatwave diminishes in surface area, with only a few scattered areas remaining.
Tropical Pacific Ocean
The marine heatwave from northern Indonesia to western Papua New Guinea remains stable overall, with moderate to strong categories. The marine heatwave in the center of the basin, around 20°N, is diminishing in intensity as the strong category and surface extent decrease. The marine heatwave to the east of the basin, off the coast of Ecuador and off the coast of Chile at around 100°W, is increasing in intensity. The marine heatwave off the coast of Mexico is decreasing in intensity and surface area.
Indian Ocean
Marine heatwaves off Madagascar, to the west and south of Australia and in the Arabian Gulf remain stable overall, with moderate and strong categories. In the Bay of Bengal, the moderate marine heatwave is diminishing in extent, with only a few scattered areas remaining.
European Zone
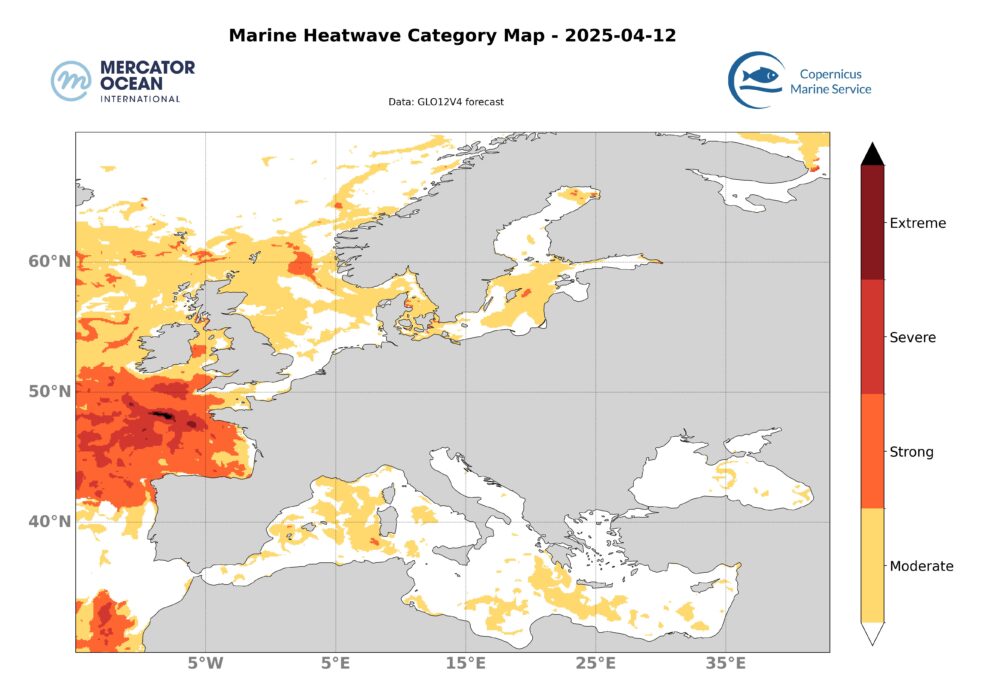
North Atlantic Ocean
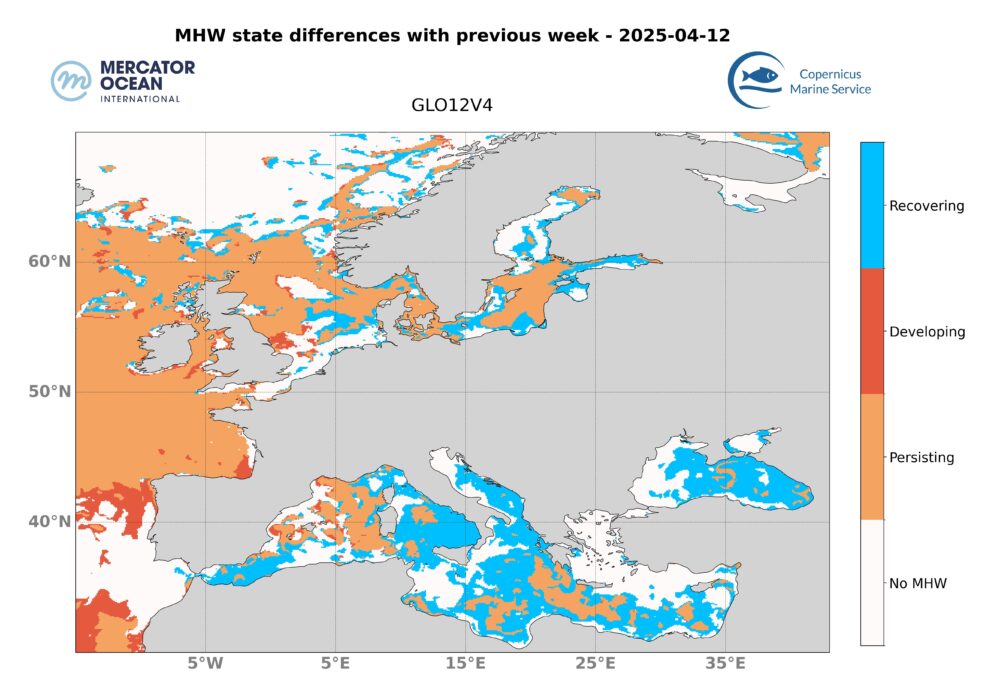
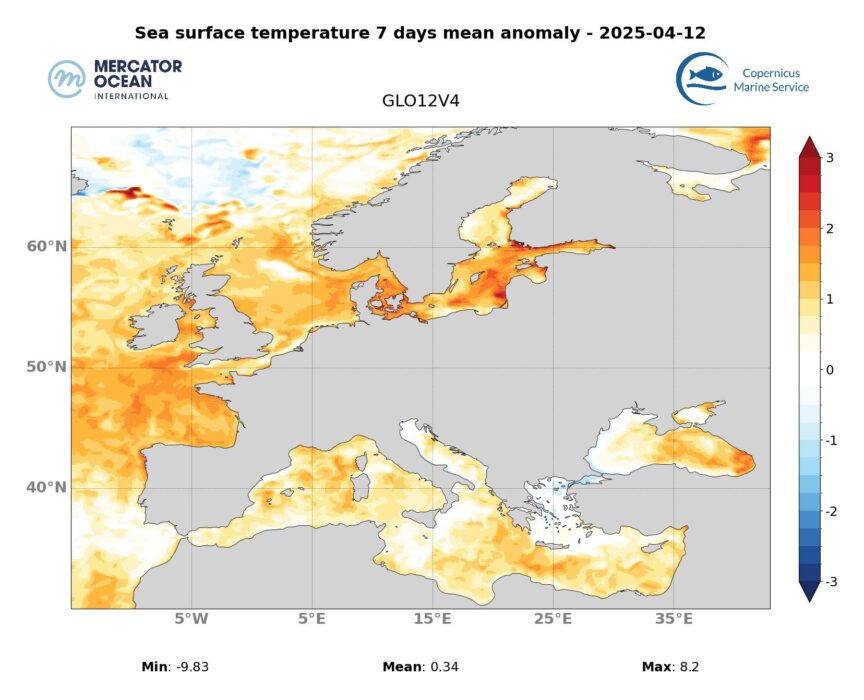
The marine heatwave off the coast of Europe, between southern Ireland and northern Portugal, is intensifying, with an increase in the area covered by strong and severe categories, and the local appearance of extreme categories. To the west of Ireland and north of the British Isles, the marine heatwave remains in the moderate category. Off the coast of Morocco, a moderate to severe marine heatwave is developing.
Mediterranean Sea
The moderate marine heatwave present throughout the Mediterranean basin is diminishing in extent, and only a few scattered areas remain in the moderate category.
Weekly Temperature Anomalies
06/04/2025-12/04/2025
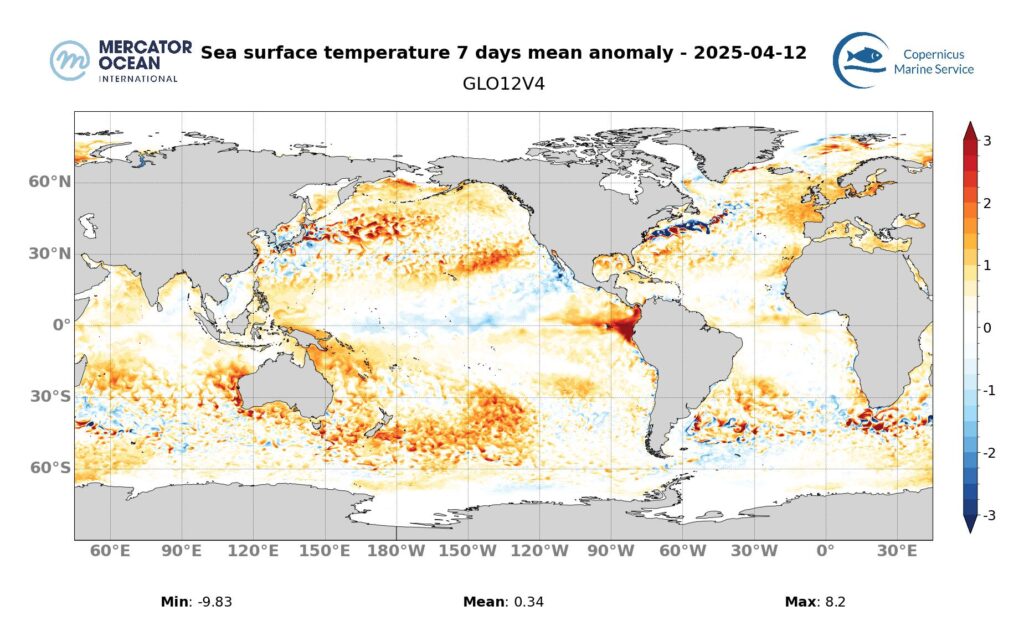
Mean sea surface temperature anomalies in each global ocean region for the week 6 to 12 April, 2025.
| Mediterranean Sea | 0°C to 1.5°C |
| Tropical Pacific Ocean | -1°C to 3°C |
| North Atlantic Ocean | -3°C à 3°C |
| Tropical Atlantic Ocean | -2°C to 2°C |
| Indian Ocean | 0°C to 3°C |
Access the Daily Global Physical Bulletin for a 9-day forecast here.
SURVEY
Help us improve our content! Answer a quick survey about this bulletin here.
What are marine heatwaves?
Marine heatwaves (MHW) are extreme rises in ocean temperature for an extended period of time. They can occur at different locations in the ocean, and their magnitude and frequency have increased over the last couple of decades, with harmful impacts on ecosystems, and human activities. According to the latest report released by the Intergovernmental Panel on Climate Change (IPCC AR6 SYR), it is found with high confidence that in the near-term at 1.5°C global warming, the increasing frequency of marine heatwaves will increase risks of biodiversity loss in the oceans, including from mass mortality events.[2]
How are marine heatwaves calculated?
A marine heatwave is an episode during which the ocean temperature is abnormally warm for at least 5 consecutive days.
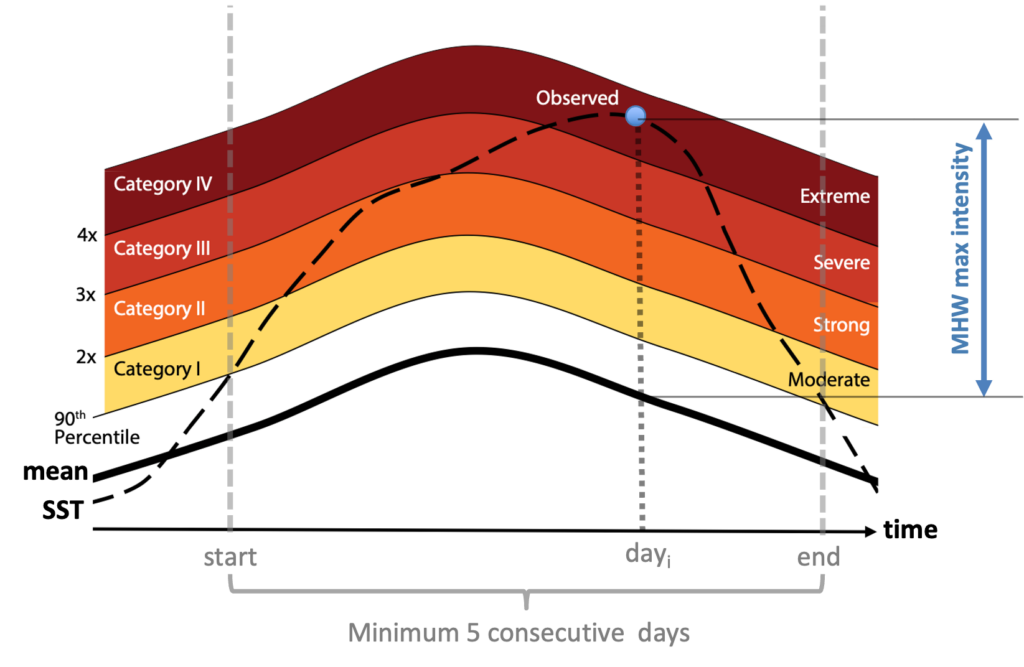
Adapted from Hobday et al. (2018)
For any location in the ocean, the normal temperatures are defined for every day of the year using a climatological period (here 1993–2016). A heatwave is identified when the measured daily temperature is within the top 10% of the highest recorded values for that day (i.e., above the 90th percentile, see diagram), and with this condition persisting for at least five consecutive days.
The intensity of the heatwave on any given day is measured as the number of degrees above the climatological average (represented by the bold black line) indicated by the blue arrow. We can either calculate the cumulative intensity over the entire heatwave or record the maximum intensity.
Heatwaves are classified based on their intensity level. To do this, the intensity is compared to the difference between the climatological value and the 90th percentile value. A mhw intensity between 1 and 2 times this difference corresponds to a heatwave of moderate category; between 2 and 3 times, to a strong category; between 3 and 4 times, to a severe category; and a difference greater than 4 times corresponds to an extreme category.
Notes
Datasets and products :
Global Ocean Physics Analysis and Forecast (sea surface temperature) E.U. Copernicus Marine Service/ Mercator Ocean International. https://doi.org/10.48670/moi-00016
[2] IPCC AR6 SYR chapter 4.3 https://www.ipcc.ch/report/ar6/syr/downloads/report/IPCC_AR6_SYR_LongerReport.pdf