Mercator Ocean International oceanographers examine marine heatwaves across the global ocean for the month of June and forecasts for the first part of July 2023. They analyse a variety of datasets from observation analyses (satellite sea surface temperature maps) to model analyses (assimilating satellite and in situ observations) and model forecasts¹.

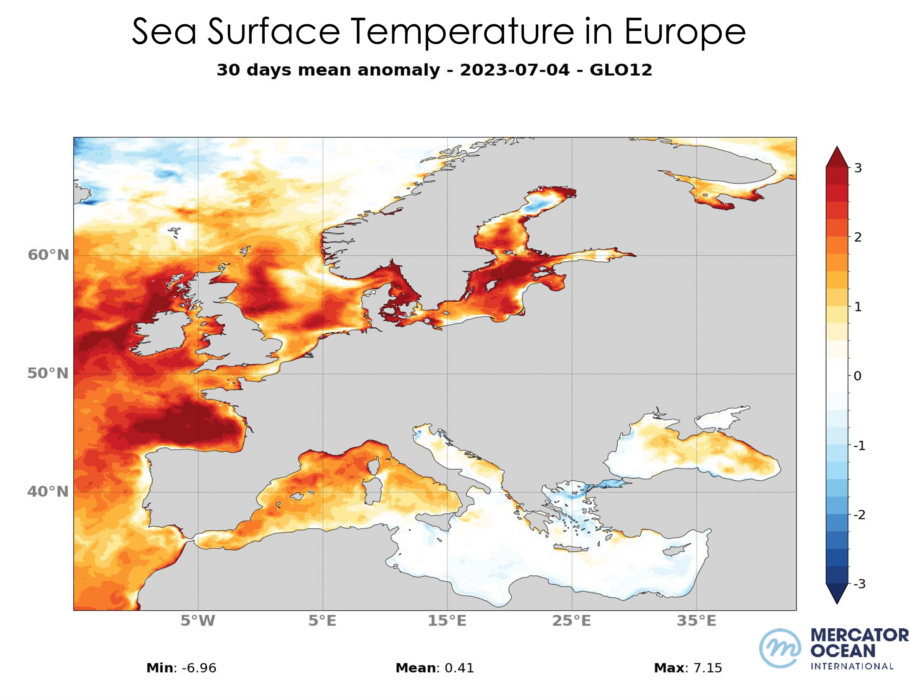
Figure 1: Surface temperature anomaly from the GLO12 analysis and forecasting system (Mercator Ocean) averaged over the 30 days preceding 4 July 2023. The reference climatology is made up of daily GLORYS12 maps averaged over the period 1993-2016. Source: Mercator Ocean International
Key take-aways from early July 2023
- The intensity of the heatwave for most of the North Atlantic region has decreased considerably, moving from the extreme category to a more moderate, and disappearing in most of the North Sea.
- Well observed heatwaves with moderate to high intensity to the west of the Gulf of Mexico, and to the east, along the coast of Morocco, western Sahara and Mauritania.
- The tropical Pacific region is experiencing a moderate heat wave reaching high intensity near the coast of Peru, which is consistent with current El Niño conditions.
Forecasts for the second half of July 2023
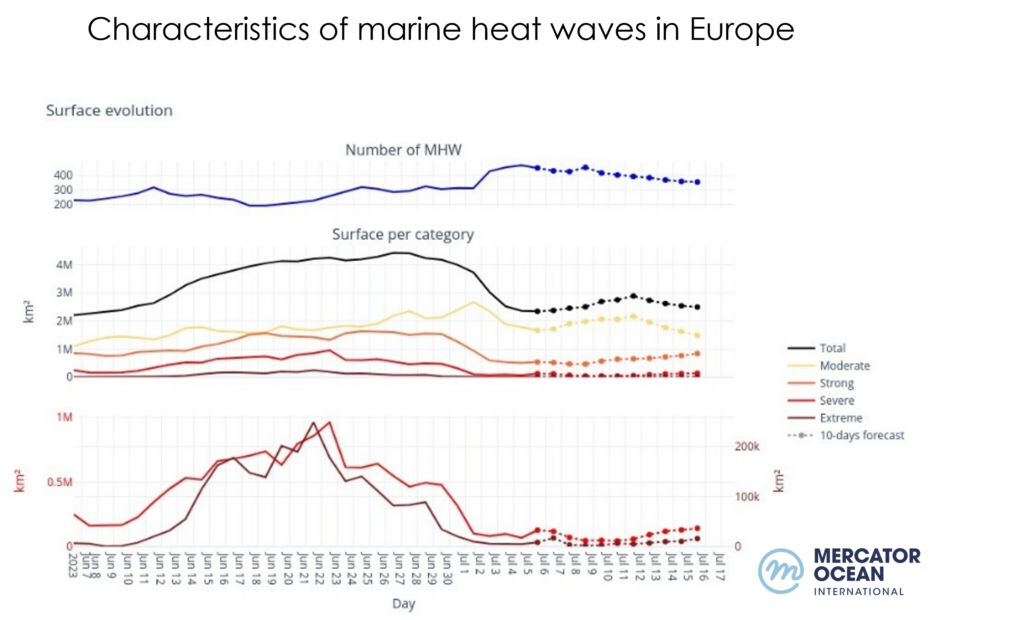
- In the North-East Atlantic, the heatwave continues to weaken, dropping to a moderate category or disappearing.
- The heatwave in the tropical Atlantic remains stable in the models.
- The heatwave to the west of the Mediterranean is intensifying, moving from a moderate to a strong category. In particular, it is moving from strong and severe to severe and extreme at the Strait of Gibraltar (and even above extreme on the coast of the Strait).
- There are several areas to keep an eye on, such as the Bay of Bengal, where there are suspicions of a strong heatwave, but these have not been confirmed by all the products, and southern Greenland, where a strong heatwave could appear.

Figure 2: Characteristics of marine heat waves over the European North Atlantic, calculated from surface temperatures from the GLO12 analysis and forecasting system (Mercator Ocean). Solid lines: analysis, dashed lines: forecast. Number of marine heat waves in blue (note that when the surface area of the heat wave is large, there are fewer heat waves), total surface area (km2) of heat waves in the area in black, surface area (km2) of heat waves of moderate intensity (yellow), strong intensity (orange), severe intensity (red) and extreme intensity (brown). Criteria used: Oliver et al (2021) https://doi.org/10.1146/annurev-marine-032720-095144
Marine heatwaves (MHW) are extreme rises in ocean temperature for an extended period of time. They can occur at different locations in the ocean, and their magnitude and frequency have increased over the last couple of decades, with harmful impacts on ecosystems, and human activities. According to the latest report released by the Intergovernmental Panel on Climate Change (IPCC AR6 SYR), it is found with high confidence that in the near-term at 1.5°C global warming, the increasing frequency of marine heatwaves will increase risks of biodiversity loss in the oceans, including from mass mortality events².
¹Analysis of datasets: OSTIA sea surface temperature observations analysis (Copernicus Marine Service), OISST sea surface temperature observations analysis (NOAA), GLO12 model (Copernicus Marine Service
² IPCC AR6 SYR 4.3 https://www.ipcc.ch/report/ar6/syr/downloads/report/IPCC_AR6_SYR_LongerReport.pdf
