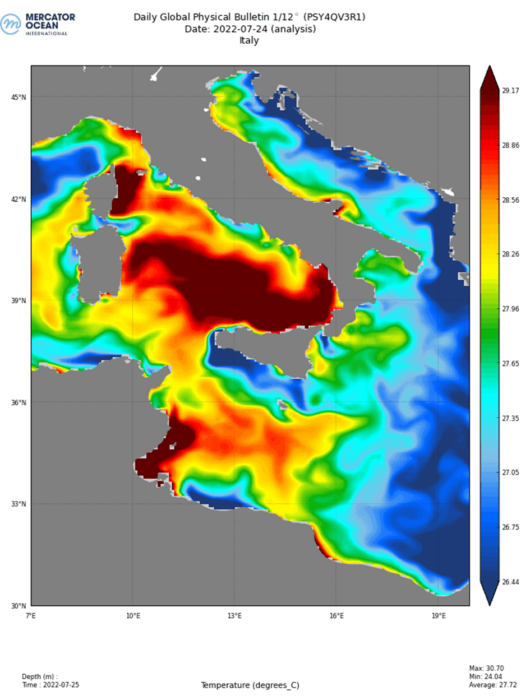
From the Balearic Sea to Sardinia, as well as east of Corsica and throughout the Tyrrhenian Sea, exceptional surface temperatures of between 28 and 30°C can be observed through the Mercator Ocean International digital ocean grid.

The surface temperature anomaly map shows higher than normal values, in the order of +4 to +5°C from the east of the Balearic Islands to the east of Corsica, with reference to the climatological base established over the last twenty years. The temperature anomaly corresponds to the difference between the value at each grid point on the day of the analysis and the value of the reference climatology at that same point.

If we zoom in on the central Mediterranean, including eastern Corsica, the Tyrrhenian Sea, and the Gulf of Gabes from north to south, we see dark red patches that represent areas where the surface temperature reaches and then exceeds 29°C. One of the striking facts is the extension from the coastal areas towards the open sea of these values over the central Tyrrhenian Sea in particular.
Trends: sea surface temperature monitoring indicator
The Copernicus Marine Service, implemented by Mercator Ocean International, offers a series of Ocean Monitoring Indicators (OMI). One of these indicators reports the cumulative trend in sea surface temperature over the last 28 years, from 1993 to 2020.

The spatial distribution of the sea surface temperature (SST) trend in the Mediterranean shows a general warming trend, ranging from 0.001 °C/year to 0.064 °C/year, over the last 28 years. This trend is confirmed by the latest data available through recent observations in 2022, and reproduced by our digital systems, as seen above.
Ocean warming impacts the entire ecosystem. It is important to be aware of the possible consequences for local fauna and flora, as well as the occurrence of extreme weather events that could result in natural disasters. For more information on the effects of ocean warming: Ocean Warming – Ocean Explainers
