The World Meteorological Organisation (WMO) has released its annual report on climate change, providing an overview of the state of the global climate and weather patterns over the past year. Together with numerous meteorological and hydrological organisations around the world, Mercator Ocean International contributed to the report, which examines key climate indicators such as greenhouse gases, temperatures, sea level rise, ocean heat and acidification.
Climate change continues
The WMO State of the Global Climate report 2022 highlights that droughts, floods, and heatwaves are impacting communities on every continent, costing billions of dollars. The Antarctic sea ice has fallen to its lowest extent on record, and some glaciers are melting rapidly. Despite the cooling impact of a La Niña event, the years 2015-2022 were the eight warmest on record. The report states that melting of glaciers and sea level rise, which reached record levels in 2022, will continue into the long-term future. The report also focuses on the impacts of climate change, including rising undernourishment, population displacement, and worsened conditions for displaced people.
The ocean and sea ice are continued victims of global warming
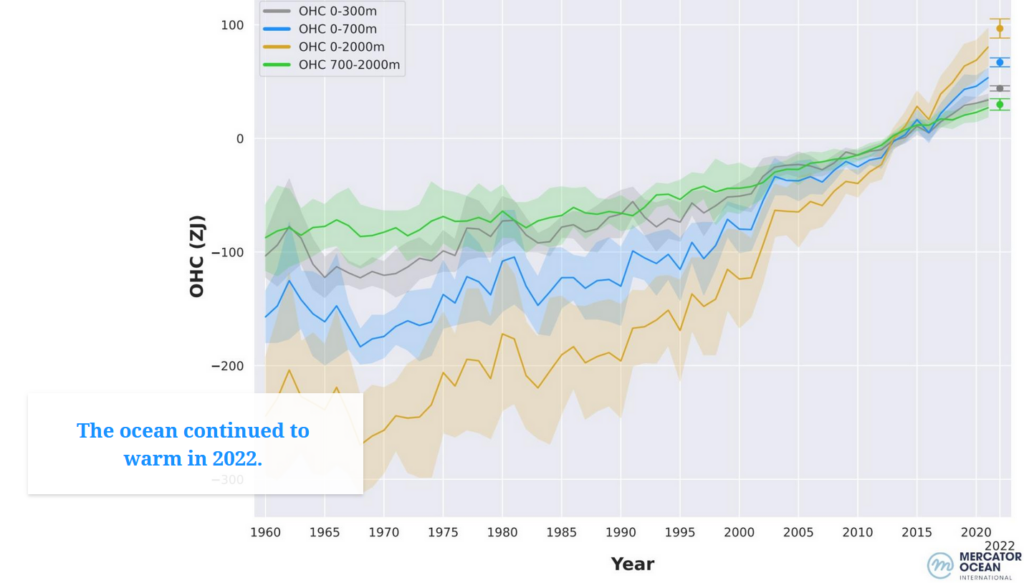
The report finds that about 90% of the energy trapped in the climate system by greenhouse gases goes into the ocean and that ocean heat content, which measures this gain in energy, reached a new observed record high in 2022.
Global mean sea level continued to rise, reaching a new record high (since the beginning of satellite records in the early 1990s). The rate of global mean sea level rise has doubled between the period 1993-2002, which increased at a rate of 2.27 millimetres (mm) per year and the period 2013-2022, which saw a rate of 4.62 mm per year.
Ocean acidification, at record highs, threatens organisms and ecosystem services. The IPCC Sixth Assessment Report concluded that “There is very high confidence that open ocean surface pH is now the lowest it has been for at least 26 [thousand years] and current rates of pH change are unprecedented since at least that time.” Low pH levels correspond to high ocean acidity.
According to the WMO report, in 2022 Antarctica experienced its lowest sea ice level on record and Arctic sea ice in September was the 11th lowest monthly minimum ice extent since satellite records began. Land ice loss contributed 36% to global sea level rise while ocean warming (thermal expansion) contributed 55%.
Mercator Ocean Scientific Expertise
Dr. Karina von Schuckmann, oceanographer at Mercator Ocean International, is a contributing author to the report. She is specialized in ocean climate monitoring, specifically looking at the ocean’s absorption of heat, a key element in quantifying and understanding global warming.
This finding was first released in a recent paper on which Dr. von Schuckmann was a lead author. This research was linked with the WMO co-sponsored Global Climate Observing System (GCOS)[1] and an international team of 70 researchers from 15 countries and was published earlier this month in the journal Earth System Science Data[2].
“We found that found that about 89% of the excess anthropogenic heat built up in the Earth system over the past six decades has been absorbed by the Ocean. Additionally, over the last 15 years, the accumulated heat in the ocean has risen by nearly 50% in comparison to the amount accumulated over the last 50 years. This has led to sea level rise, alterations in ocean circulation patterns, weather phenomena, as well as numerous negative impacts on marine ecosystems. This has widespread implications for us as humans as it touches many aspects of our lives from food security to world economies,”
explains Dr. Karina von Schuckmann, oceanographer at Mercator Ocean International, summing up some of the key findings of the paper.
Ocean heat content
Dr. von Schuckmann’s research, Mercator Ocean expertise, along with Copernicus Marine Service data contributed to the WMO report key findings surrounding ocean warming.
The top 2000 meters of the ocean experienced a sustained increase in temperature in 2022, which is predicted to persist in the coming years and result in irreversible changes over the next hundreds and even thousands of years. The ocean heat content was the highest on record in 2022, surpassing the previous year’s value by 17 ± 9 ZJ (Zeta Joules) (see figure 1).
Verified across multiple datasets, the report found that ocean warming rates were particularly high in the past twenty years. Ocean warming for 0-2000 metres has been increasing at a rate of 0.7 ± 0.1 Watts per square metre from 1971-2022; however, this increased in 2006 to 2022 at a rate of 1.2 ± 0.2 Watts per square metre. Below 2000 metres, which is considered the deep ocean, is estimated to be warming at a rate of 0.0725 ± 0.1 Watts per square metre from 1992-2022, globally.

.
Lead author Lijing Cheng of the Institute of Atmospheric Physics in Beijing, China, published a recent paper examining ocean heat content[3]. Many of their key findings were used in the WMO report, some of which are paraphrased below.
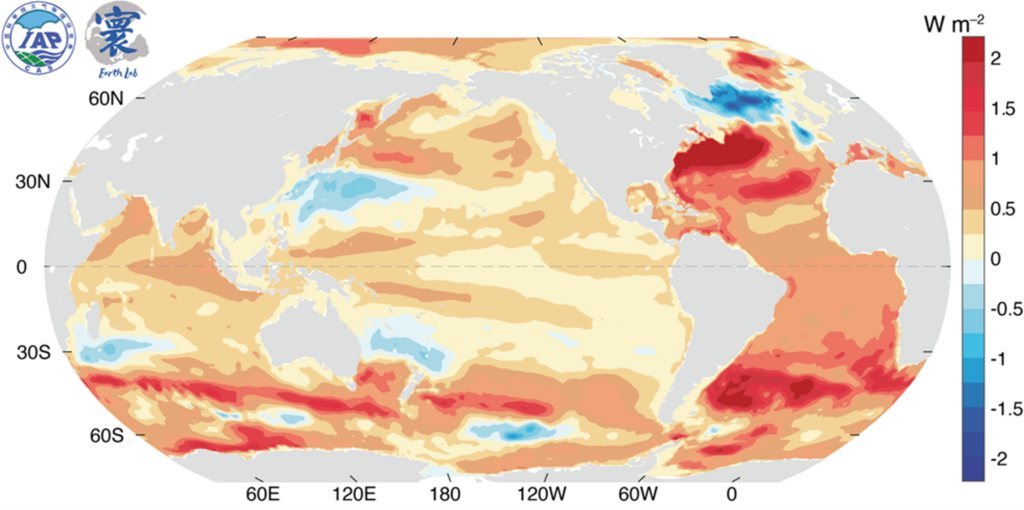
Though global ocean heat content (OHC) is at a record high, the rate of warming is not uniform across all regions. In the upper 2000 metres the most intense warming has been observed in the Southern Ocean, North Atlantic, and South Atlantic (refer to figure 2). The Southern Ocean is the Earth’s primary heat reservoir, contributing to approximately 36% of the global OHC increase in the upper 2000 meters since 1958. This heating trend is linked to the uptake of human-caused heat by the cold upwelling waters, which are then transported by the background overturning circulation to the northern edge of the Antarctic Circumpolar Current.
There are certain relatively small areas where cooling is taking place, such as the subpolar Atlantic Ocean, spanning from the near surface to depths greater than 800 meters (it is also the sole region to exhibit prolonged cooling at the surface). The trends of cooling (between 50°N and 70°N) and warming (between 20°N and 50°N) found in the North Atlantic is linked to an observed slowing of the Atlantic Meridional Overturning Circulation and local interactions between the air and sea.

An evident need for action
The WMO State of the Global Climate report 2022 is accompanied by a story map that provides policymakers with information on climate change indicators and how improved technology makes the transition to renewable energy cheaper and more accessible. Published right before Earth Day (23rd April 2023), the report echoes the UN Secretary-General Antonio Guterres’s call for accelerated climate action: “We have the tools, the knowledge, and the solutions. But we must pick up the pace. We need accelerated climate action with deeper, faster emissions cuts to limit global temperature rise to 1.5 degree Celsius. We also need massively scaled-up investments in adaptation and resilience, particularly for the most vulnerable countries and communities who have done the least to cause the crisis.”
Release of the WMO State of the Global Climate report 2022
The press conference to release the State of the Global Climate 2022 will be held on Friday 21 April 2023 at the United Nations in Geneva (hybrid) and will be broadcast live by UN TV Home | UN Web TV at 1300 CEST with:
- Prof. Petteri Taalas, WMO Secretary-General
- Dr Omar Baddour, WMO Chief of Climate Monitoring
Useful links and related topics
- WMO State of the Global Climate report 2022 and official press release
- Global Warming and the Ocean: a new study led by Mercator Ocean International expert sheds light on the Earth’s Energy Imbalance
- Global sea surface temperatures reach record high
[1] https://public.wmo.int/en/media/news/new-study-shows-earth-energy-imbalance
[2] von Schuckmann K., et al. Heat stored in the Earth system 1960–2020: where does the energy go? ESSD, 15, 1675–1709, 2023. https://doi.org/10.5194/essd-15-1675-2023
[3] Cheng, L., Abraham, J., Trenberth, K.E. et al. Another Year of Record Heat for the Oceans. Adv. Atmos. Sci. 40, 963–974 (2023). https://doi.org/10.1007/s00376-023-2385-2
[4] Cheng, L.; Trenberth, K. E.; Fasullo, J. et al. Improved estimates of ocean heat content from 1960 to 2015, Science Advances 2017, 3 (3), e1601545. https://doi.org/10.1126/sciadv.1601545
