The operational forecasting systems developed by Mercator Ocean are based on ocean models described by primitive equations. They assimilate in real-time ocean measurements from satellite and in situ observation systems. Currently only the physical models assimilate observations. Work is now being done on marine biogeochemistry which should make it possible to assimilate observations of water colour, among others, in the near future.

The three main system components are:

  • input data (atmospheric forcing and observations)
  • assimilation data
  • modelling

Input data in Mercator Ocean systems

The operational Mercator Ocean systems receive input from many data sources for operational requirements (real-time data) but also for reanalysis (delayed time data). These data sources are also used to validate systems.

Real-time data

Atmospheric forcing

Data• The wind vector at 10m in m.s-1 (noted: Uair)
• Air temperature at 2m in °C (noted: Tair)
• Relative humidity in the air at 2m in % (noted: RH)
• Surface atmospheric pressure in Pa (noted: Ps)
• Incident solar flux in W.m-2(noted: radsolaire)
• Incident infrared flux in W.m-2 (noted: radir)
• Precipitation flux in mm.s-1 (noted: P)
Resolution• Real-time analysis and forecasting: 34, T1279 0.125°x0.125°
• ERAINTERIM reanalysis: 6h, T255, 80km
Data source• Atmospheric forecasting model
Data center• European Centre for Medium-Range Weather Forecasts (ECMWF)

Assimilated data

Satellite data

Sea Level Anomaly (SLA)

Resolution• Daily updating
• Along-track data
Use• Assimilation: along-track data are assimilated in all Mercator operational forecasting systems.
• Along-track data are also used for validation purposes.
Data sourceAVISO
Data centerSsalto/Duacs

Sea Surface Temperature (SST)

Resolution• Temporal: daily (AVHRR SST, RTG-SST and OSTIA)
• Spatial: 0,5° for RTG-SST (re-interpolated on model grids), 1° for AVHRR SST, 0.05° for SST OSTIA.
Use• AVHRR SST is assimilated in Mercator systems.
• All the SSTs are used for validation purposes.
Data source• Objective analyses from satellite and in situ data. The satellites are NOAA/AVHRR, but also ENVISAT, MSG, SSM/I (for sea ice), AQUA, TRMM. In situ data are: drifting buoys, ships, data available via the Global Transmission System (GTS or SMT).
Data center• RTG-SST (Real Time Global SST) by Thiebaut et al. 2003, produced by NOAA/NCEP, distributed by ECMWF.
SST AVHRR Pathfinder produced and distributed by NOAA/NCEP.
• SST OSTIA produced by the UK Met Office OSI TAC CMEMS.

In situ data TAC CMEMS

In Situ Sea Surface Temperature

Resolution• Temporal: variable measurements, daily data file
• Spatial: variable
Use• Assimilated in Mercator systems
• Used for validation purposes
Data sourceThermosalinographs (TSG) and drifting buoys
Data centerCoriolis, in-situ TAC CMEMS

Temperature/Salinity Profiles

Resolution• Temporal: variable measurements, daily data file.
• Spatial: variable
Use• Argo TAO/Pirata moorings (regular measurements)
• CTD, XBT, Gliders, Thermosalinographs (TSG - one-off measurements)
Data source• Argo TAO/Pirata moorings (regular measurements)
• CTD, XBT, Gliders, Thermosalinographs (TSG - one-off measurements)
Data centerCoriolis, in-situ TAC CMEMS

Surface Currents

Resolution• Temporal: measurements every 10 hours, weekly file containing data from the previous 10 days
• Spatial: variable
Use• The surface currents are deduced from the trajectories of drifting buoys. These data are used to validate the data source.
Data source• Drifting buoys
Data centerCoriolis, in-situ TAC CMEMS

Data that remain contact over time

Climatology

Levitus

Data• T(0-1500m), S(0-1500m) + monthly-mean statistics
• T(0-5500m), S(0-5500m) + seasonal-mean statistics
• T(0-5500m), S(0-5500m) + annual-mean statistics
Time period coveredCentury (1900-2000)
Spatial resolution1°x1°
Geographic coverageGlobal
Data CentreNOAA/NODC

Medatlas

Data• T(0-4000m), S(0-4000m) + monthly-mean statistics
• T(0-4000m), S(0-4000m) + seasonal-mean statistics
• T(0-4000m), S(0-4000m) + annual-mean statistics
Time period coveredCentury (1900-2000)
Spatial resolution0.2°x0.2°
Geographic coverageMediterranean
Data CentreEuropean MEDAR/MEDATLAS II project, distributed by SISMER

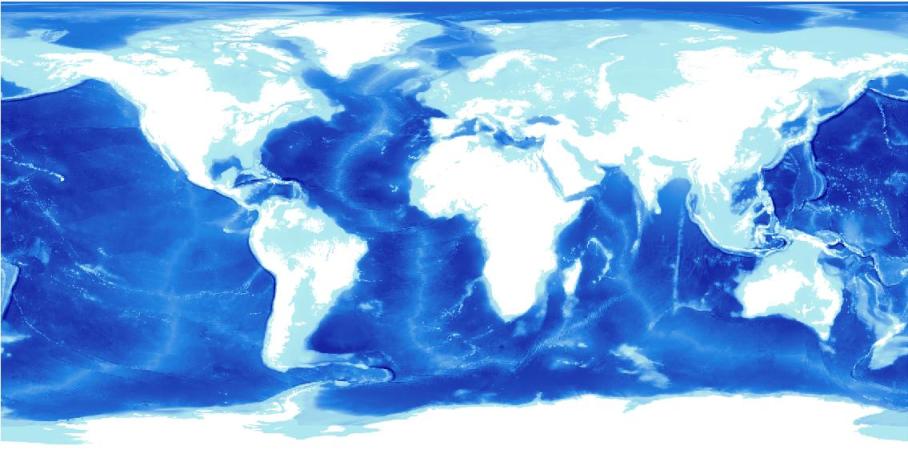
Bathymetry

ETOPO
Used in:
ORCA1 (PSY2G3R3)
ORCA12-T321
PSY4
ORCA25_LIM-T323
GLORYS2V3
PSY3
PSY2
BIOMER

Spatial resolution1 or 2 minutes angle following the session.
Geographic coverage+90° to -89°58' in latitude et -180W° to +179°58' in longitude.
Data centreNOAA/NGDC

GEBCO
Used in:
ORCA12-T321
PSY4
ORCA25_LIM-T323
GLORYS2V3
PSY3
NEATL36 (IBI36)
NEATL12 (IBIRYSV1R1)
BIOMER

Spatial resolution1 minute angle
Geographical coverageGlobal
Data sourceNOAA/NGDC: General Bathymetric Chart of the Oceans (GEBCO) one minute grid

base10
Used in NEATL36 (IBI36) et NEATL12 (IBIRYSV1R1)

Geographical coverageGlobal
Data sourceNOAA/NGDC : General Bathymetric Chart of the Oceans (GEBCO) one minute grid


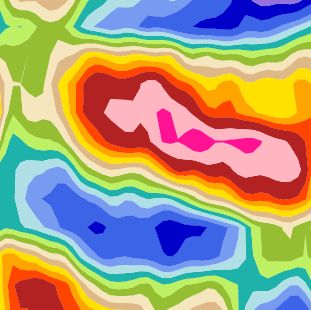
Illustration credit: ECMWF (extract of a heat flow map)

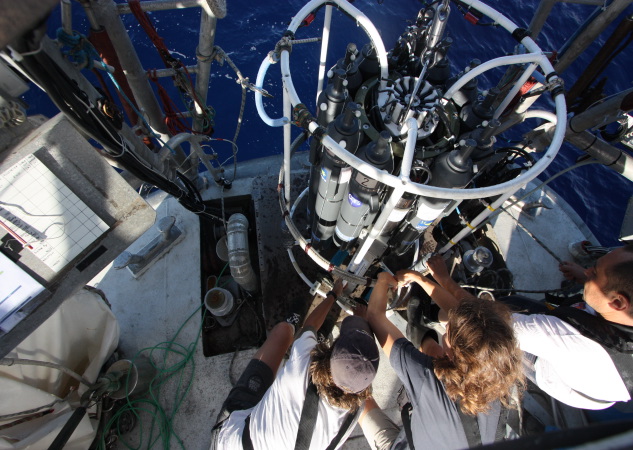
Illustration credit: Tara Expédition

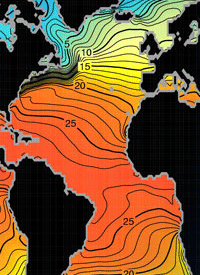
Illustration credit: NOAA/NODC

Menu