Key takeaways
- January 2025 was the 2nd warmest January on record for the global ocean, with a mean temperature of 20.86°C.
- 38.6% was the maximum surface of the ocean surrounding Europe affected by a marine heatwave event.
- In the North Atlantic, January 2025 was the 2nd most extreme January month in terms of marine heatwave events, only January 2024 was more extreme.
Sea Surface Temperature
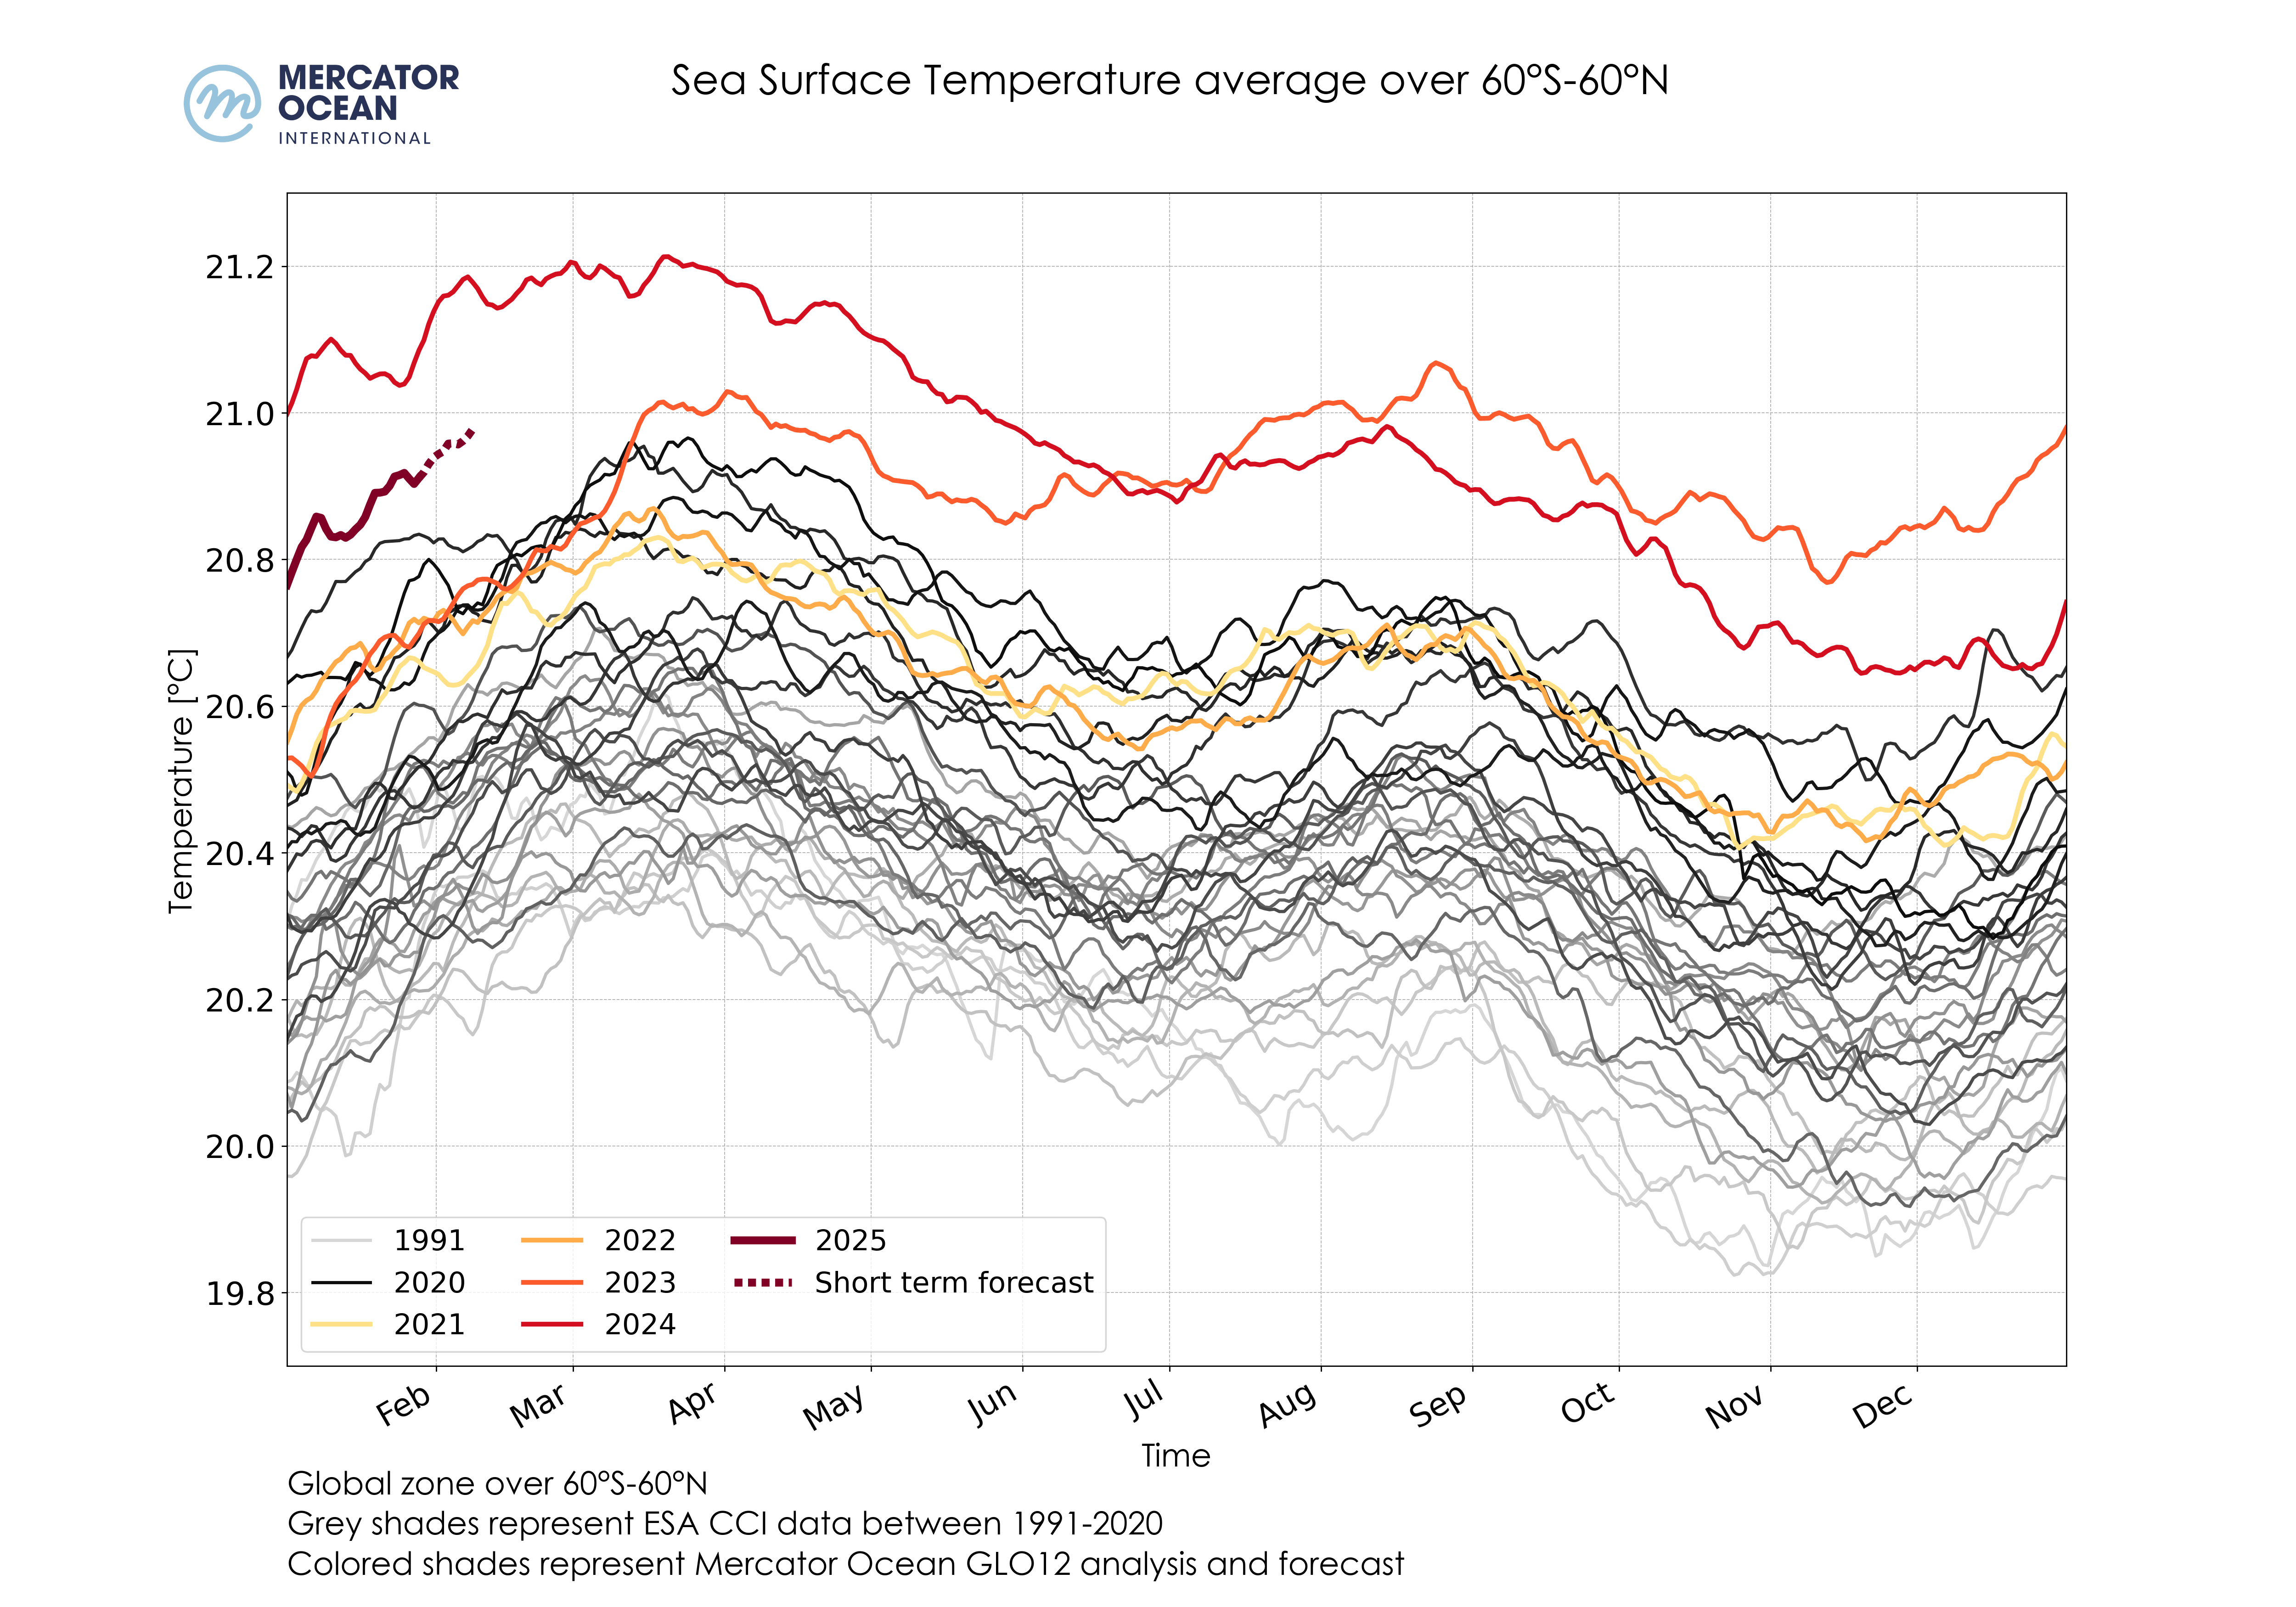
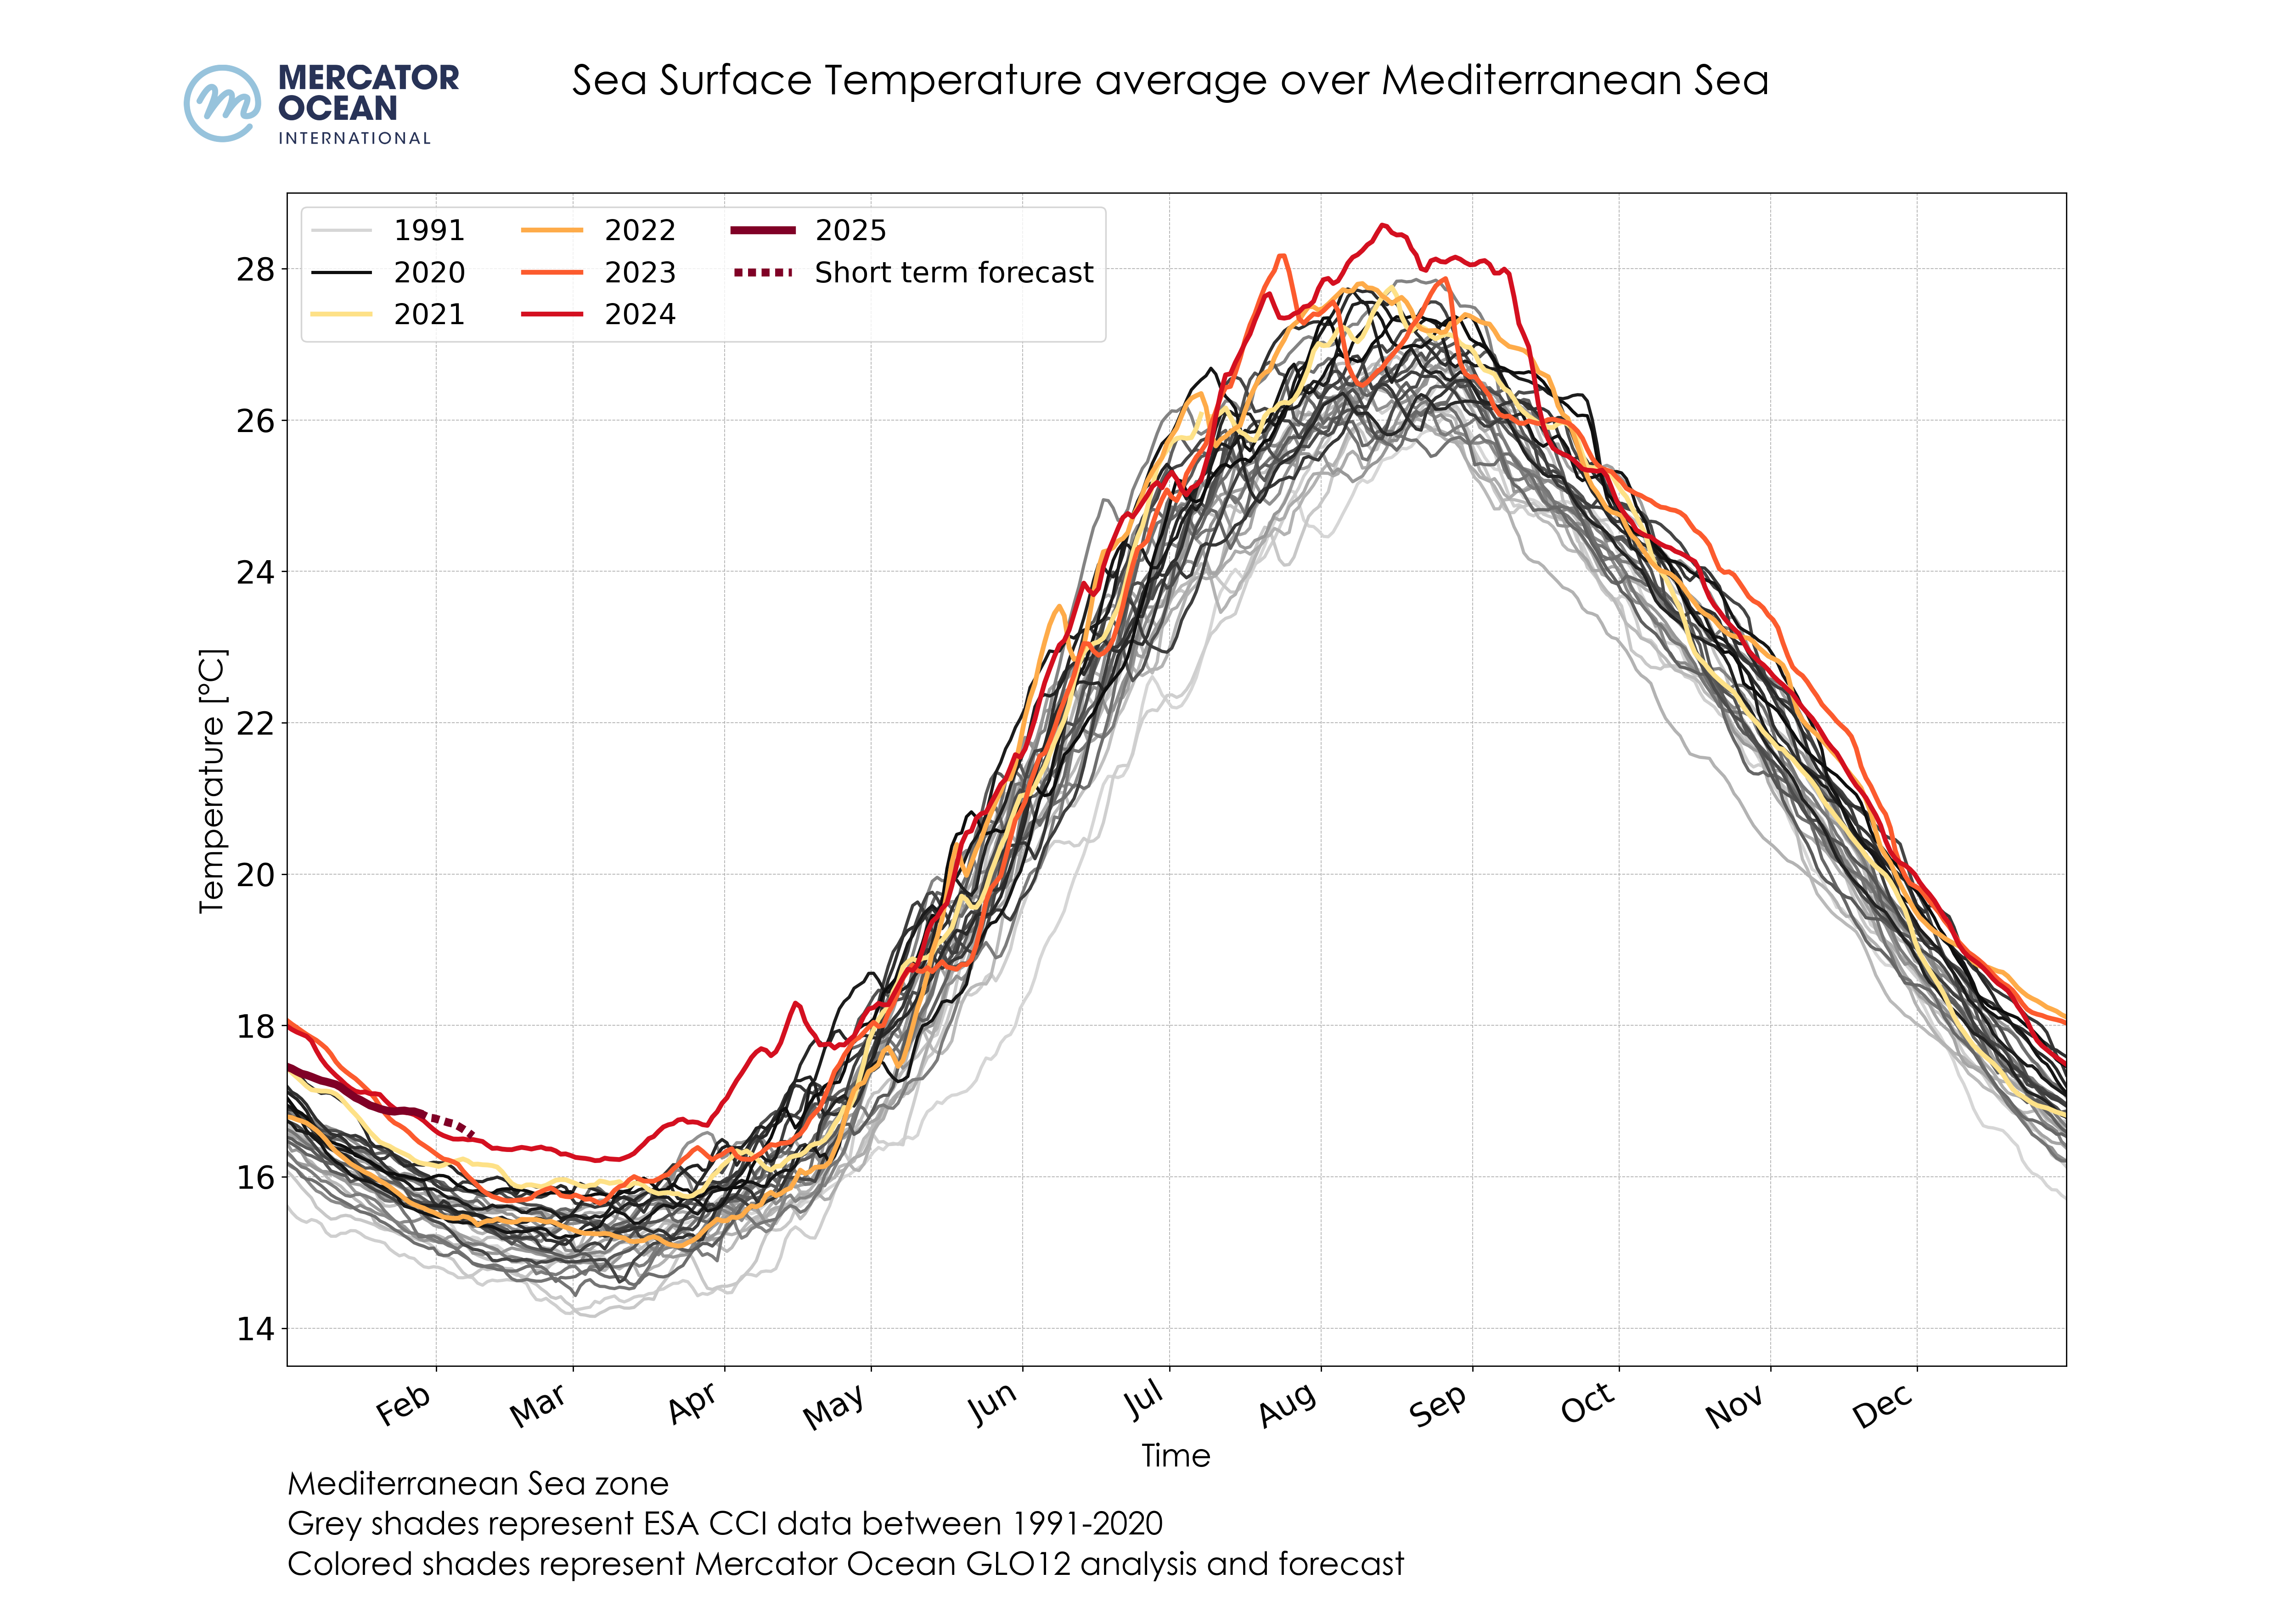
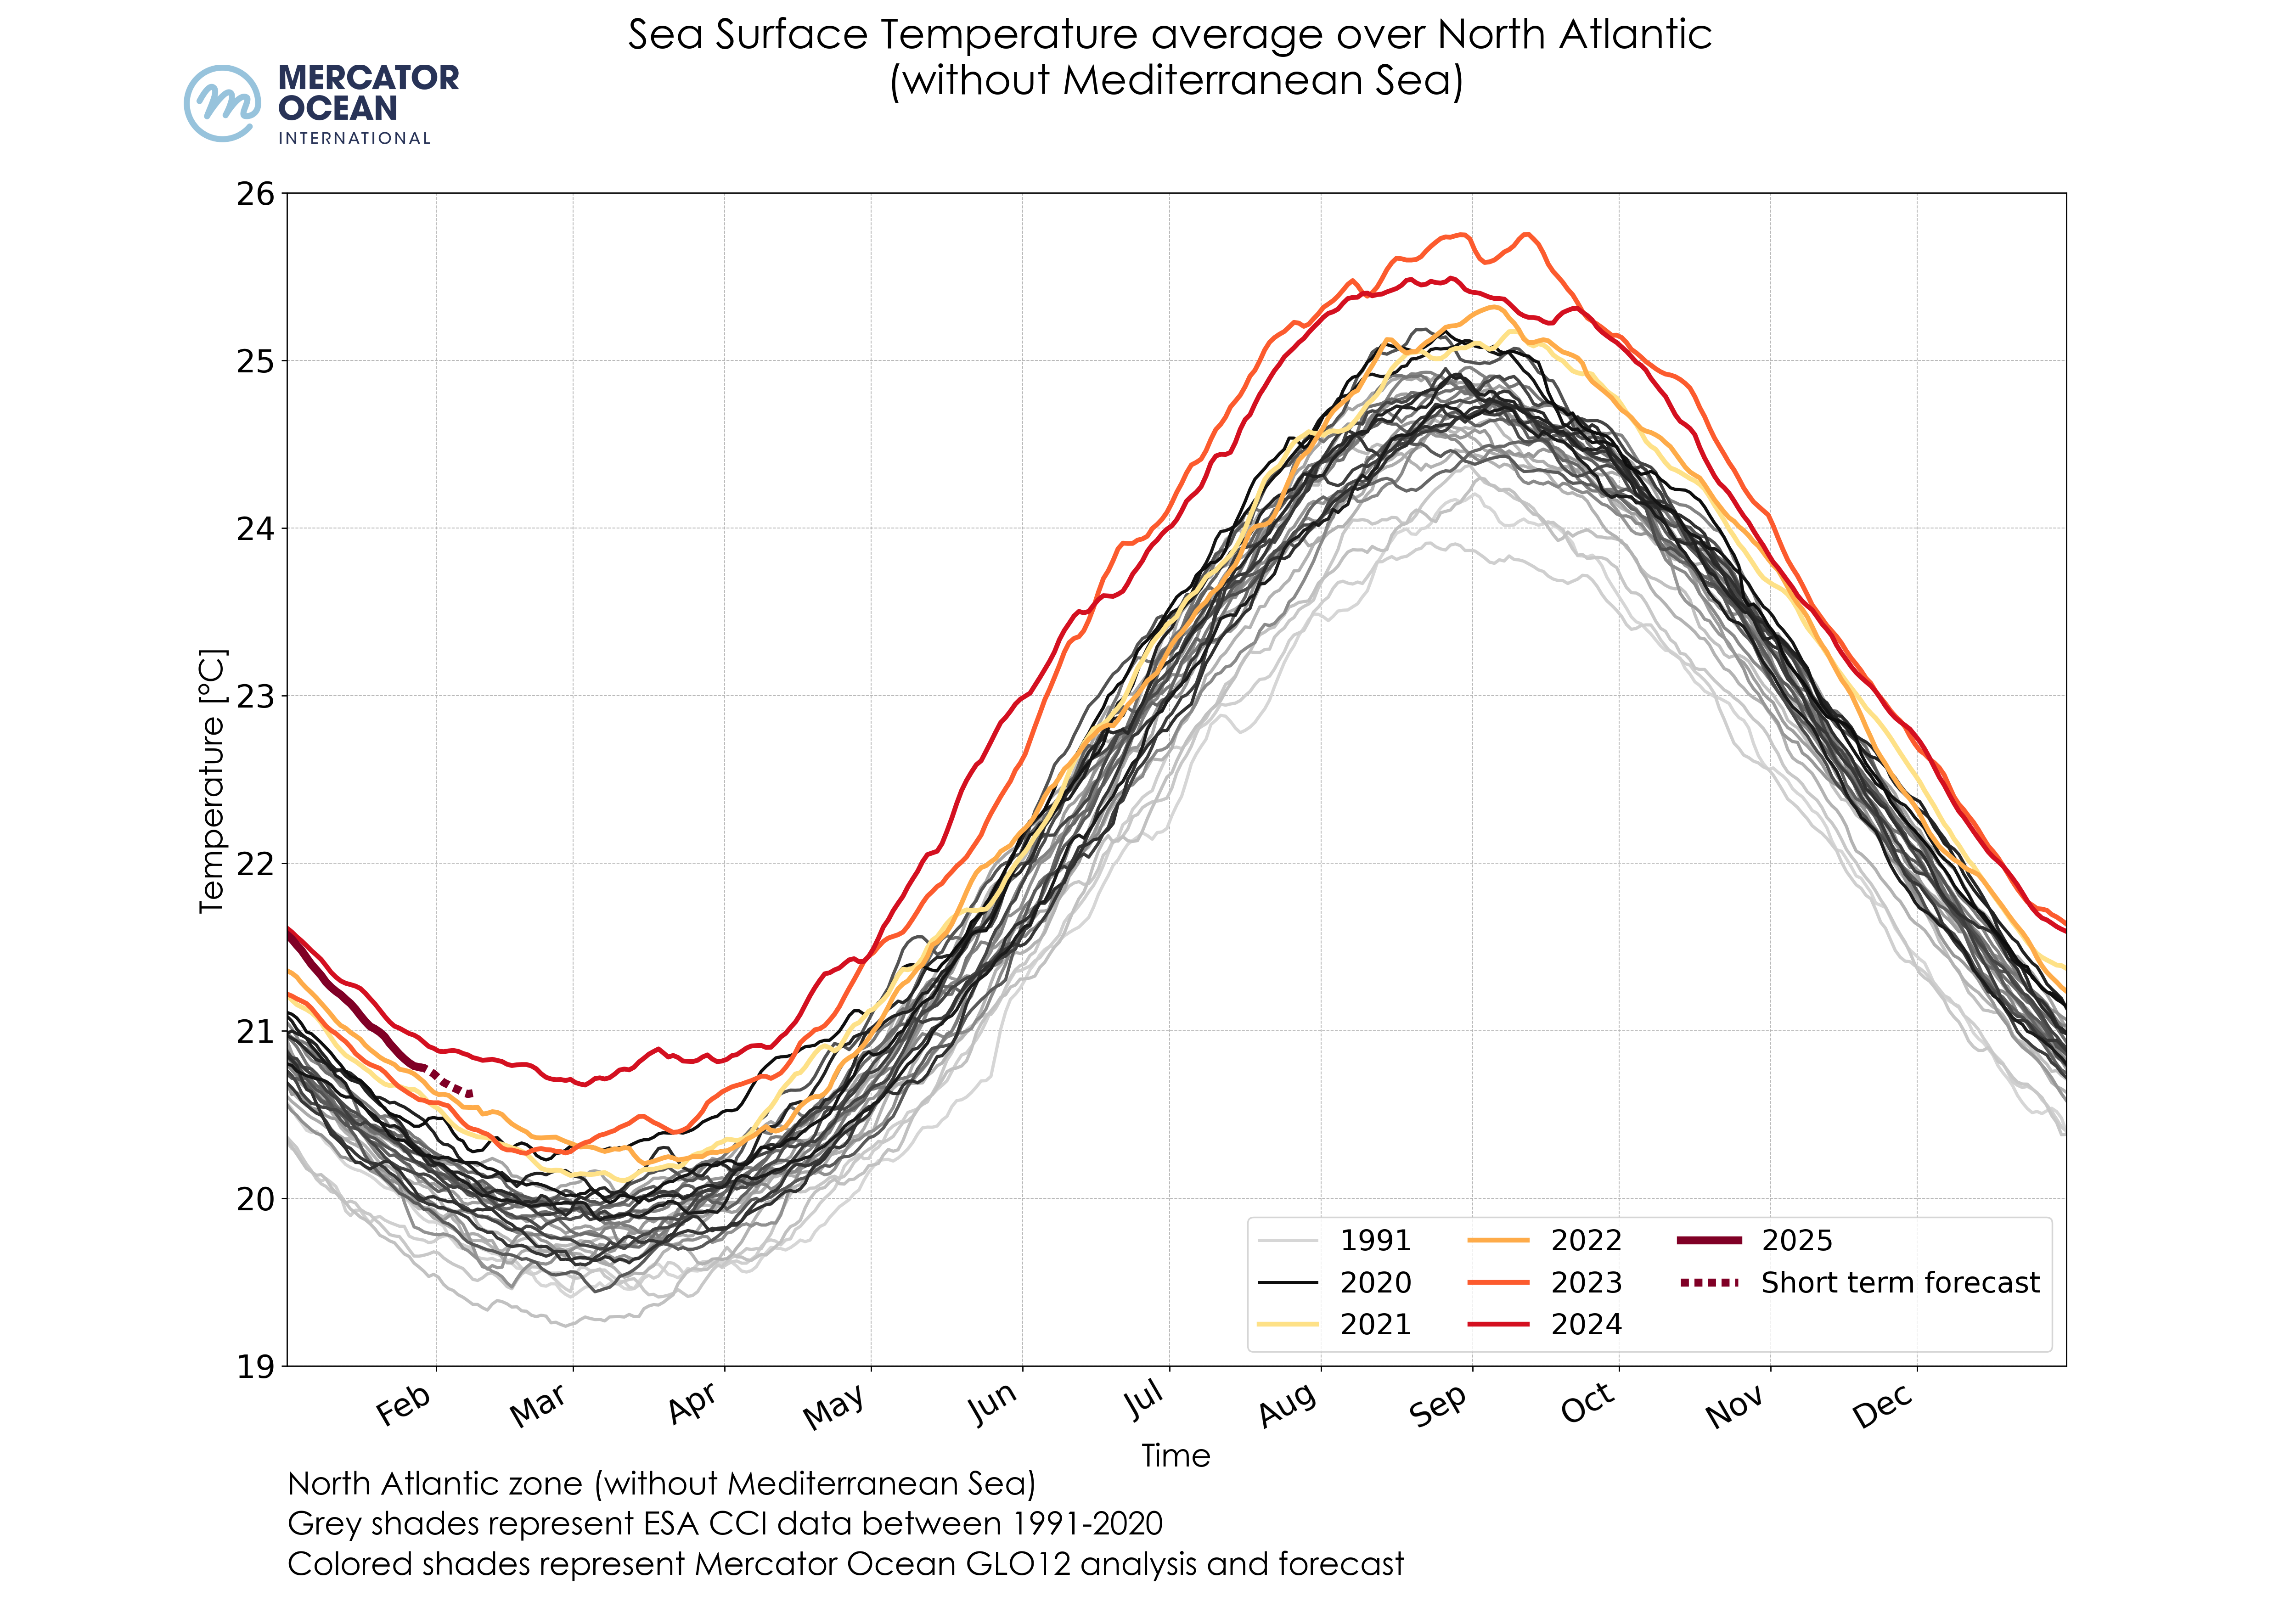
Figure 1: Daily sea surface temperatures (SST) averaged for the global ocean (top), the Mediterranean Sea (left) and the North Atlantic Ocean (right) between 1991-2020 using ESA’s Climate Change Initiative (grey shades), and between 2021-2025 (colored shades) using Mercator Ocean International’s GLO12 analysis and forecast.
- January 2025, at global level (between 60°S and 60°N), was the 2nd warmest January on record (after 2024), with a mean temperature of 20.86°C.
- Regionally, January 2025 was the 3rd January month for the Mediterranean Sea (after 2023 and 2024) with mean temperatures of 17.07°C.
- In the North Atlantic, January was the 2nd warmest (after 2024) with a mean temperature of 21.11°C.
Sea Surface Temperature Anomalies
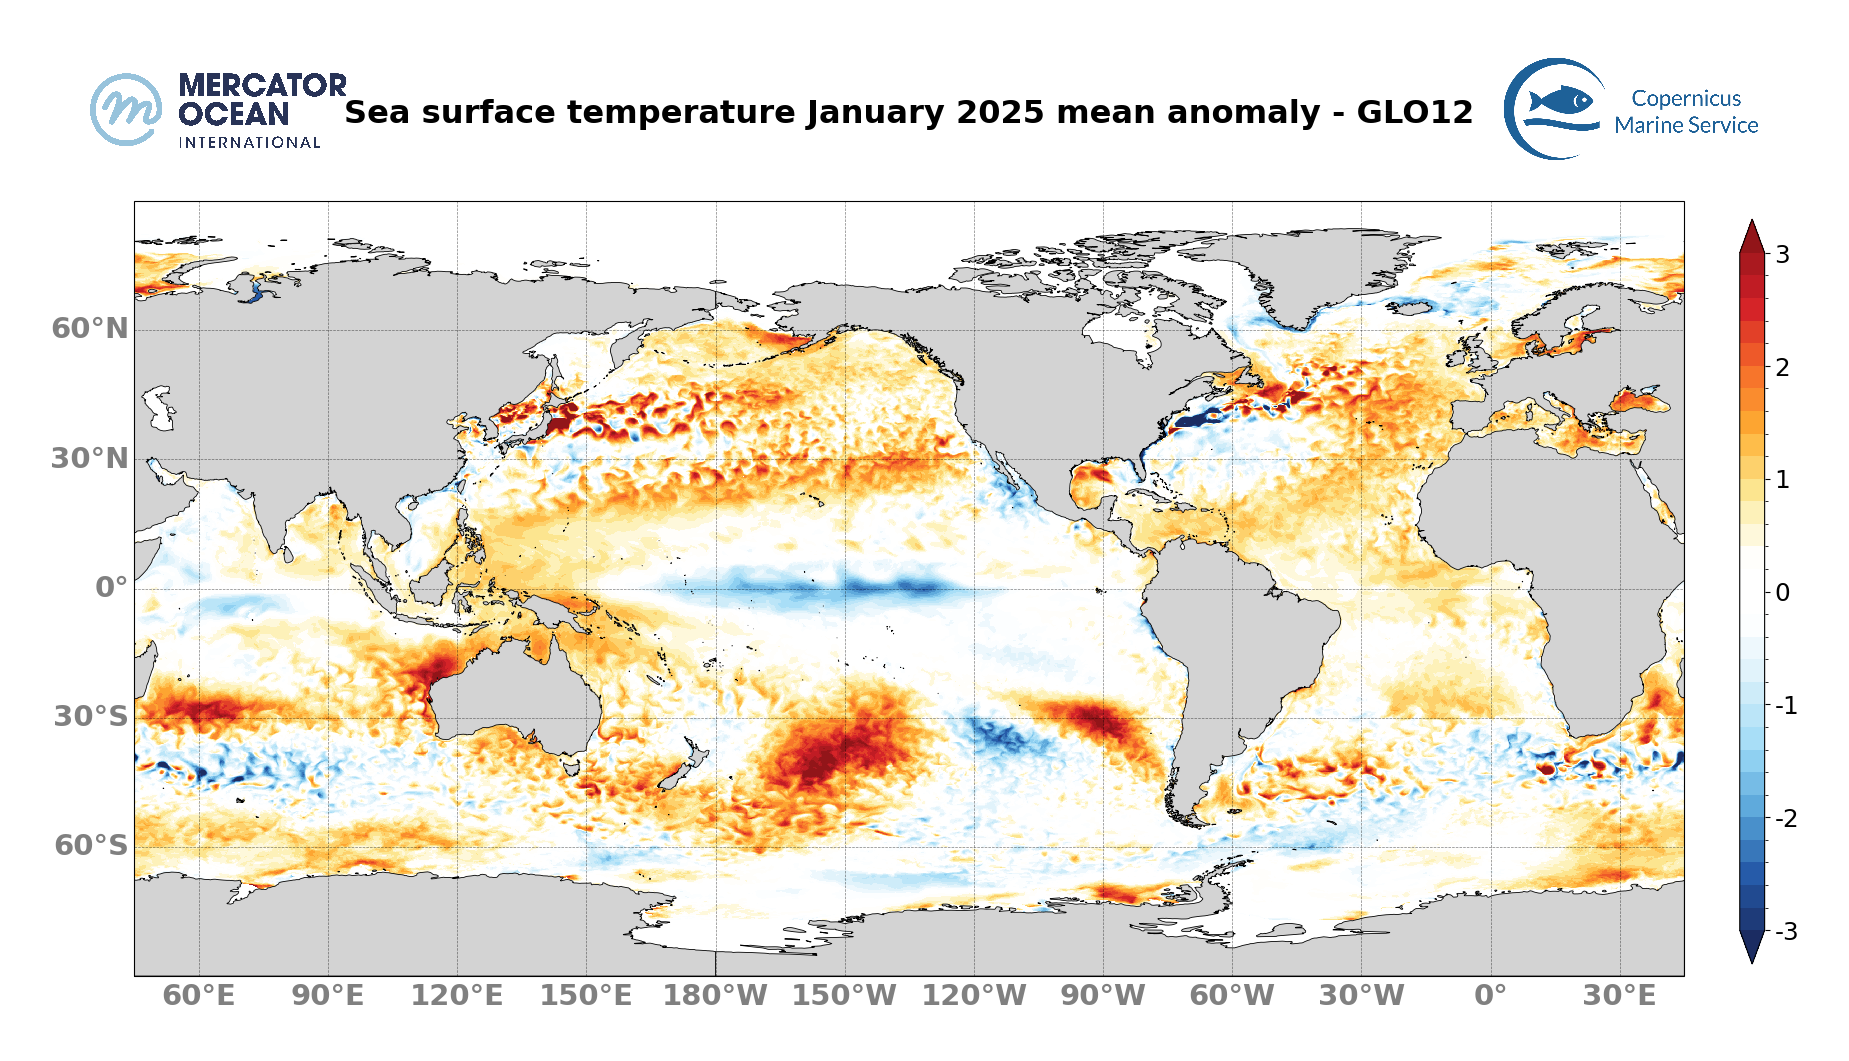
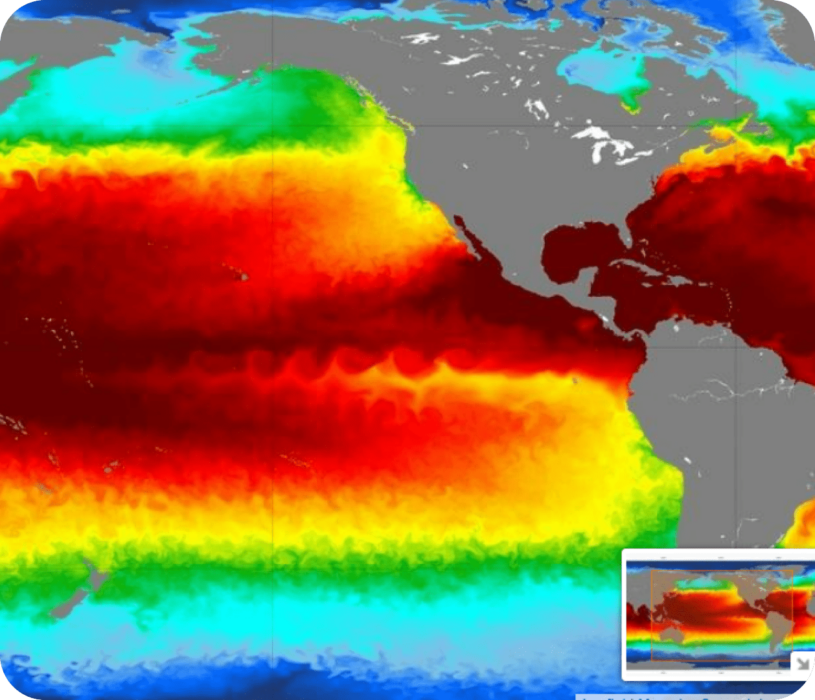
- Mean Sea Surface Temperature anomalies (Figure 2) for January 2025 are close to 1°C in the Caribbean Sea, The Mediterranean Sea and the southeast Asia region.
- Mean anomalies are higher in the southern Pacific near New Zeeland on the west and the Chilian coast on the east, northwest Australia and east of Madagascar, reaching 3°C locally.
- In the Tropical Pacific, negative anomalies persist along the equator, reaching -2°C.
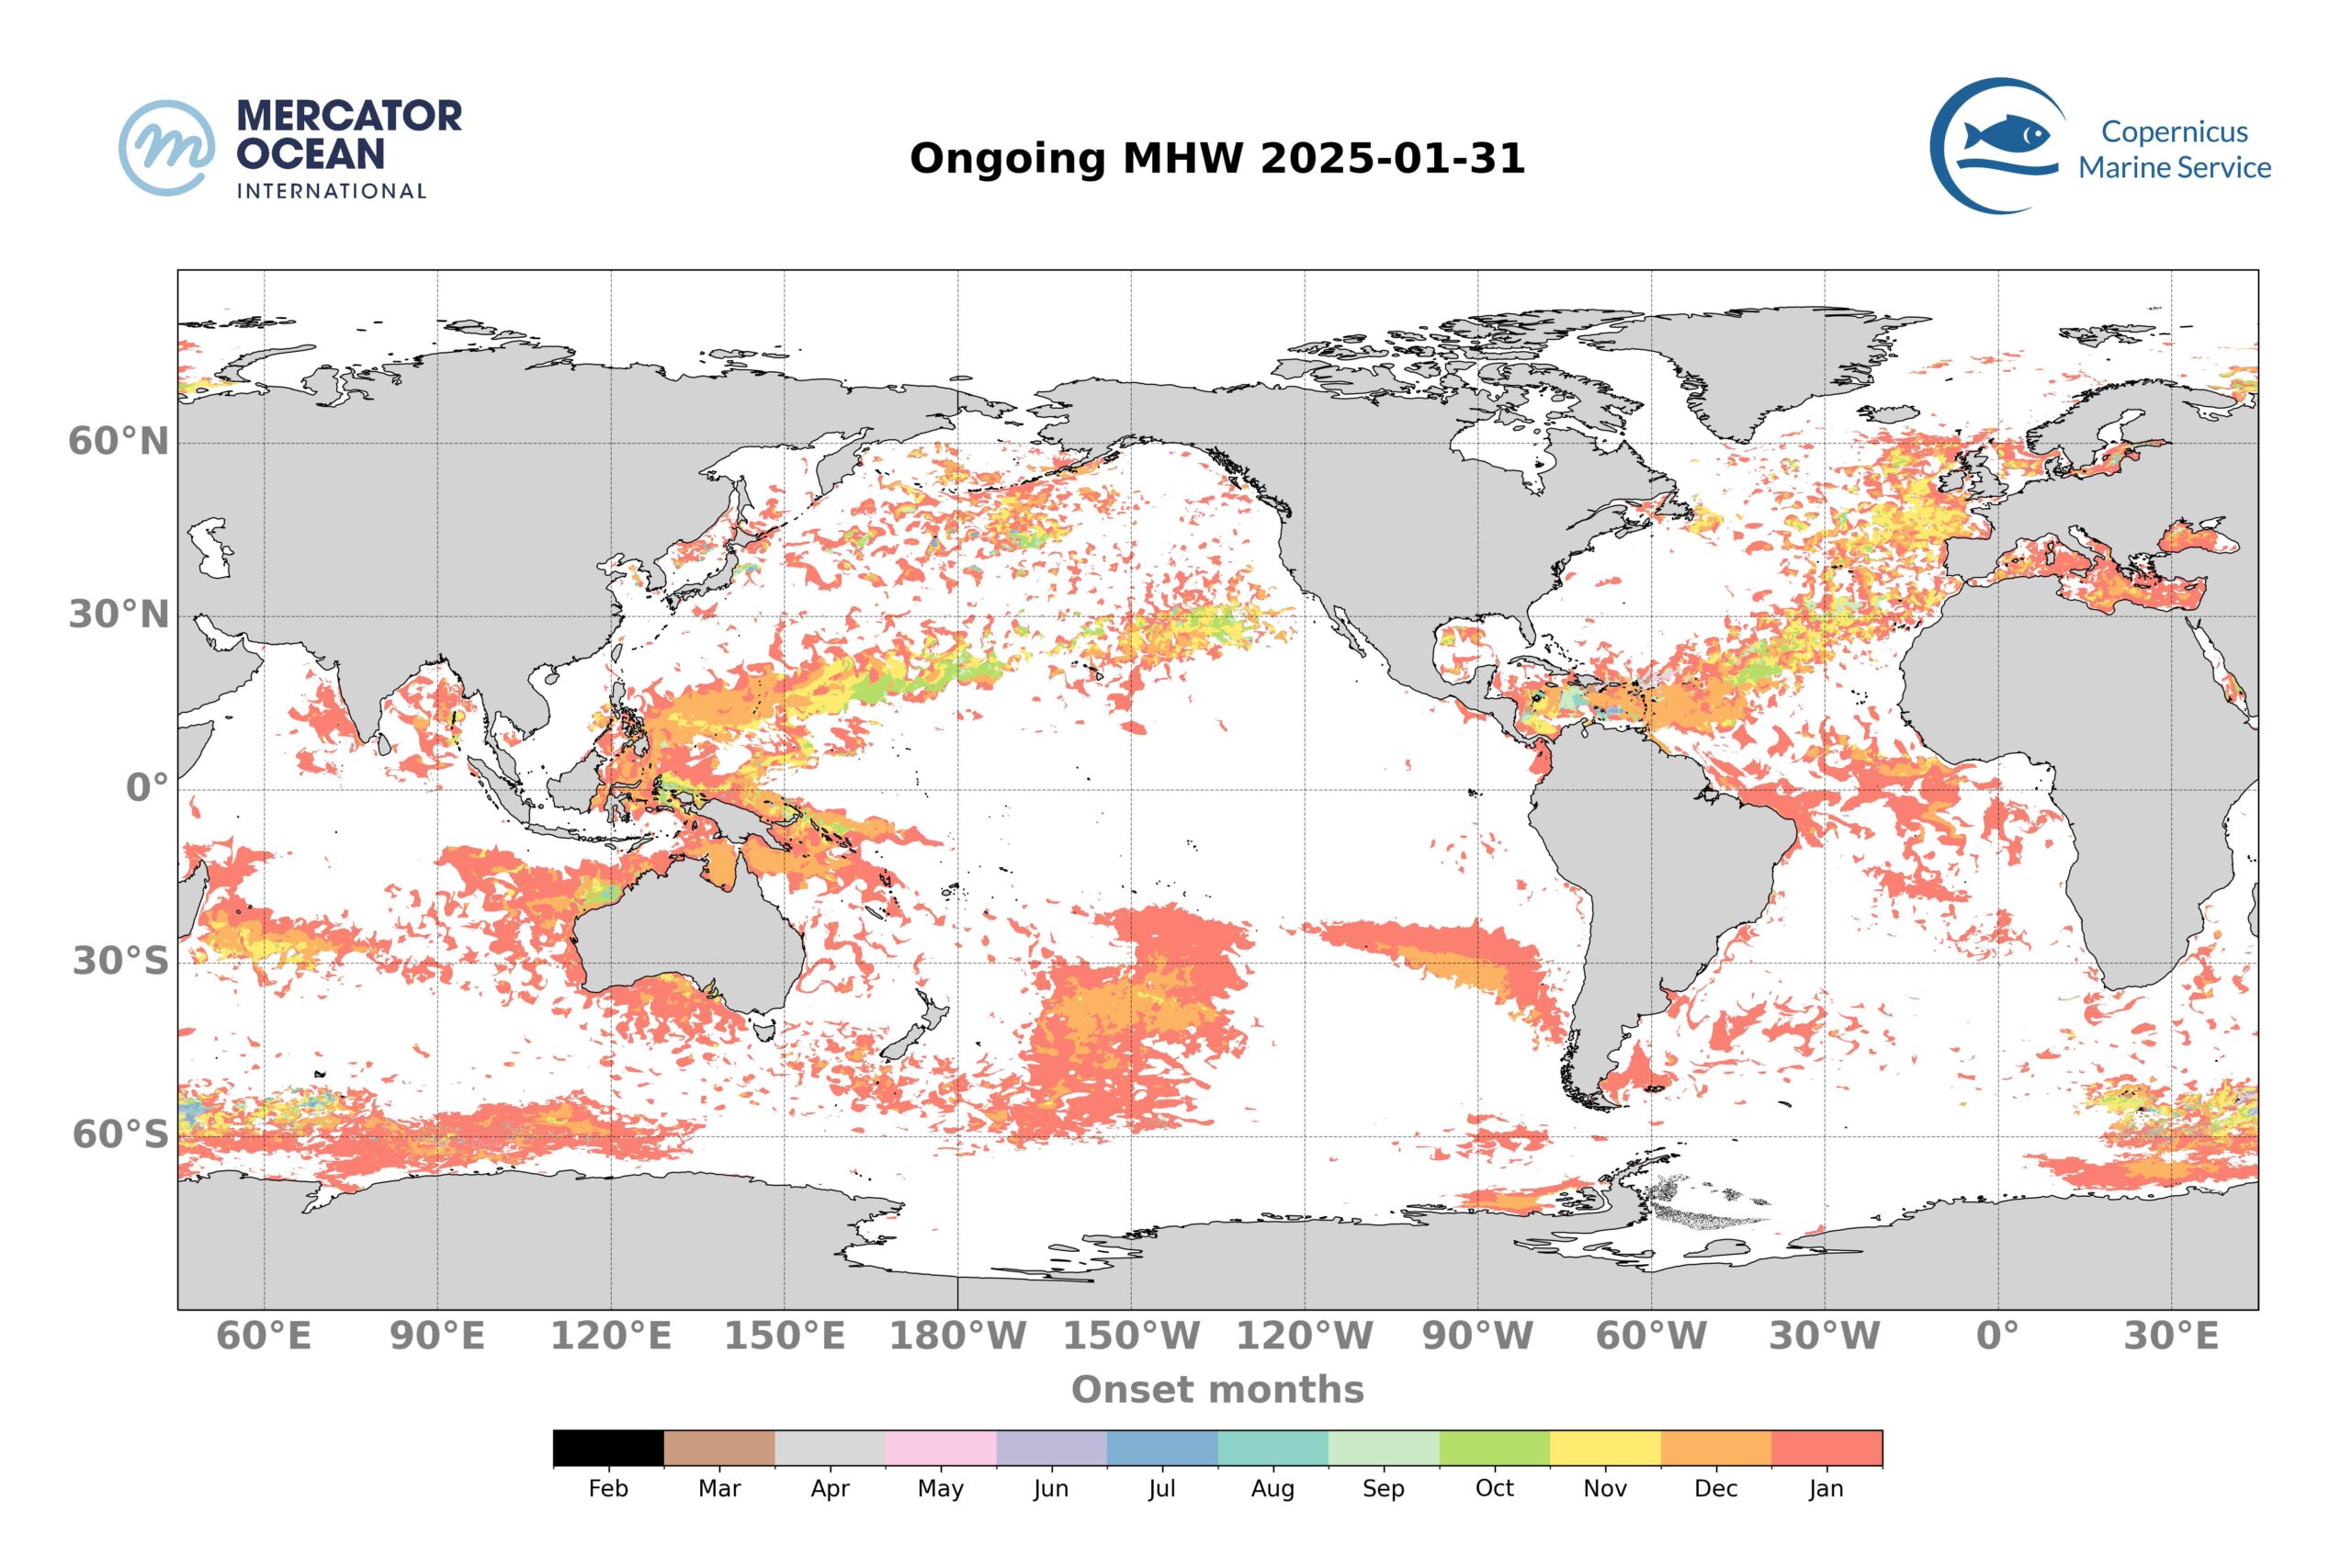
Ongoing marine heatwaves: 31 January 2025
Long warming events may induce important stress on marine ecosystems. In this section are shown the ongoing marine heatwave (MHW) events on December 31, and when those have initiated.
- 27.6 % of the global ocean (between 60°S and 60°N) were affected by MHWs on the 31st of January.
- The majority of these MHWs developed recently, with 17.9 % of the global Ocean (between 60°S and 60°N) affected by MHWs less than 1 month old and 6 % by events between 1- and 2-month-old.
- 3 % of the global ocean is affected by 2 to 4-month-old events.
Total surface exposed to marine heatwaves (January 2024 – January 2025)
We monitor daily the surface occupied by MHWs and show for the past year (since February 2024) the proportion of the global Ocean (between 60°S and 60°N) exposed to MHWs. We focus on the evolution over the past January 2025 (denoted in grey).
Global Ocean
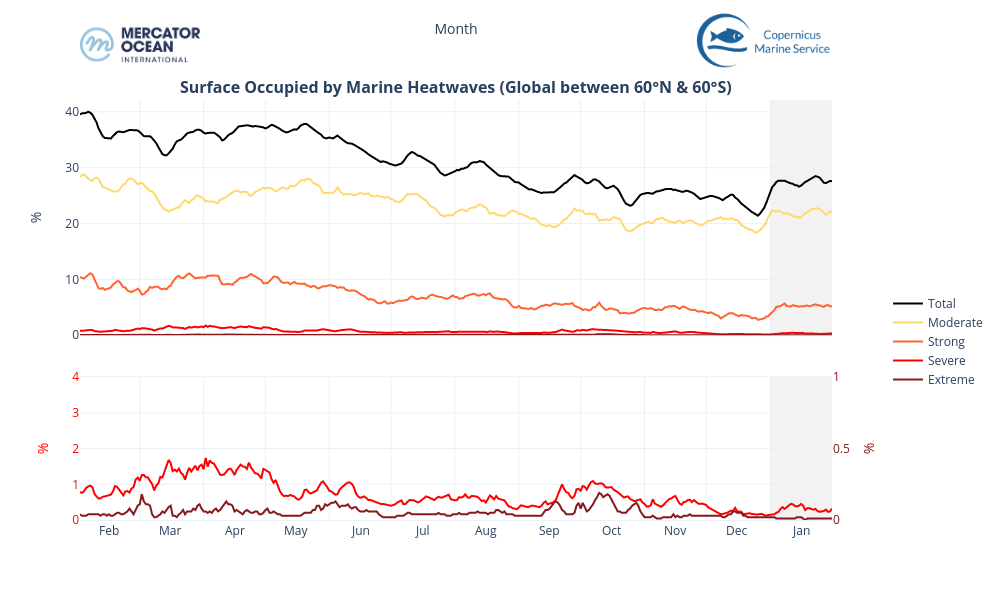
- After a rapid increase at the end of December/ beginning of January, the total surface of MHW (black line) was stable across the month with values between 26.5% and 28.5%.
- Surface of moderate category (yellow line) follows the same pattern between 21.5% and 22.7%; whereas surface of strong category (orange line) remained stable during the month (~5%).
- For comparison, in January 2024, MHW total extent ranged between 37% and 47%, with almost 10% of strong category (not shown).
European Zone
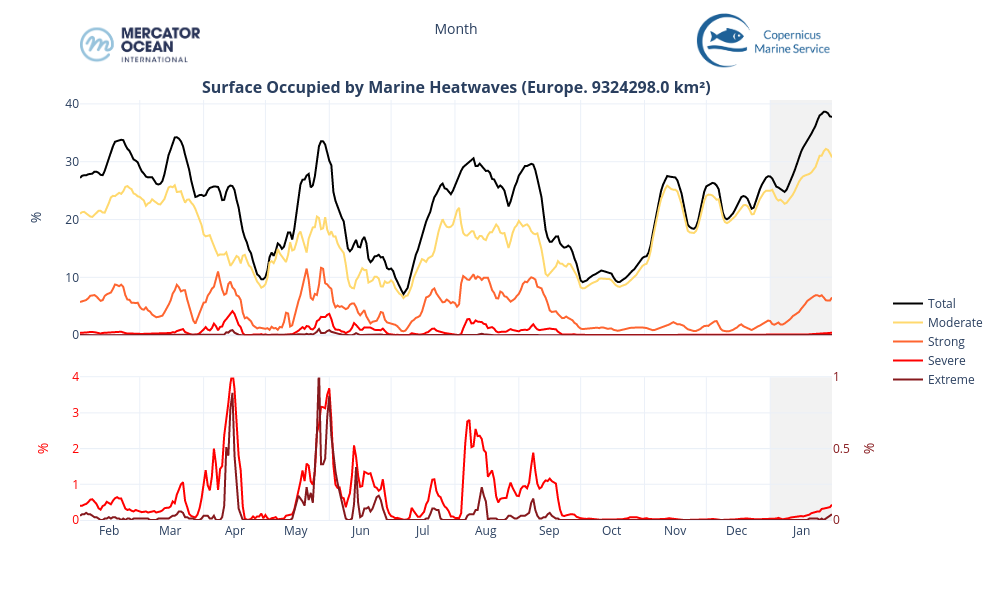
- For the ocean region of Europe (including the Mediterranean Sea and the North Atlantic eastern coast, see extent in map of ongoing MHW above), the total MHW surface increased rapidly (from ~25% to 38.6%), reaching an extent larger than the same period in 2024.
- This increase is mostly composed of moderate and strong categories (from ~23% to 32% and from ~2% to almost 7%, respectively). For comparison, in January 2024, the total extent remained under 30%.
Total number of marine heatwave days for January 2025
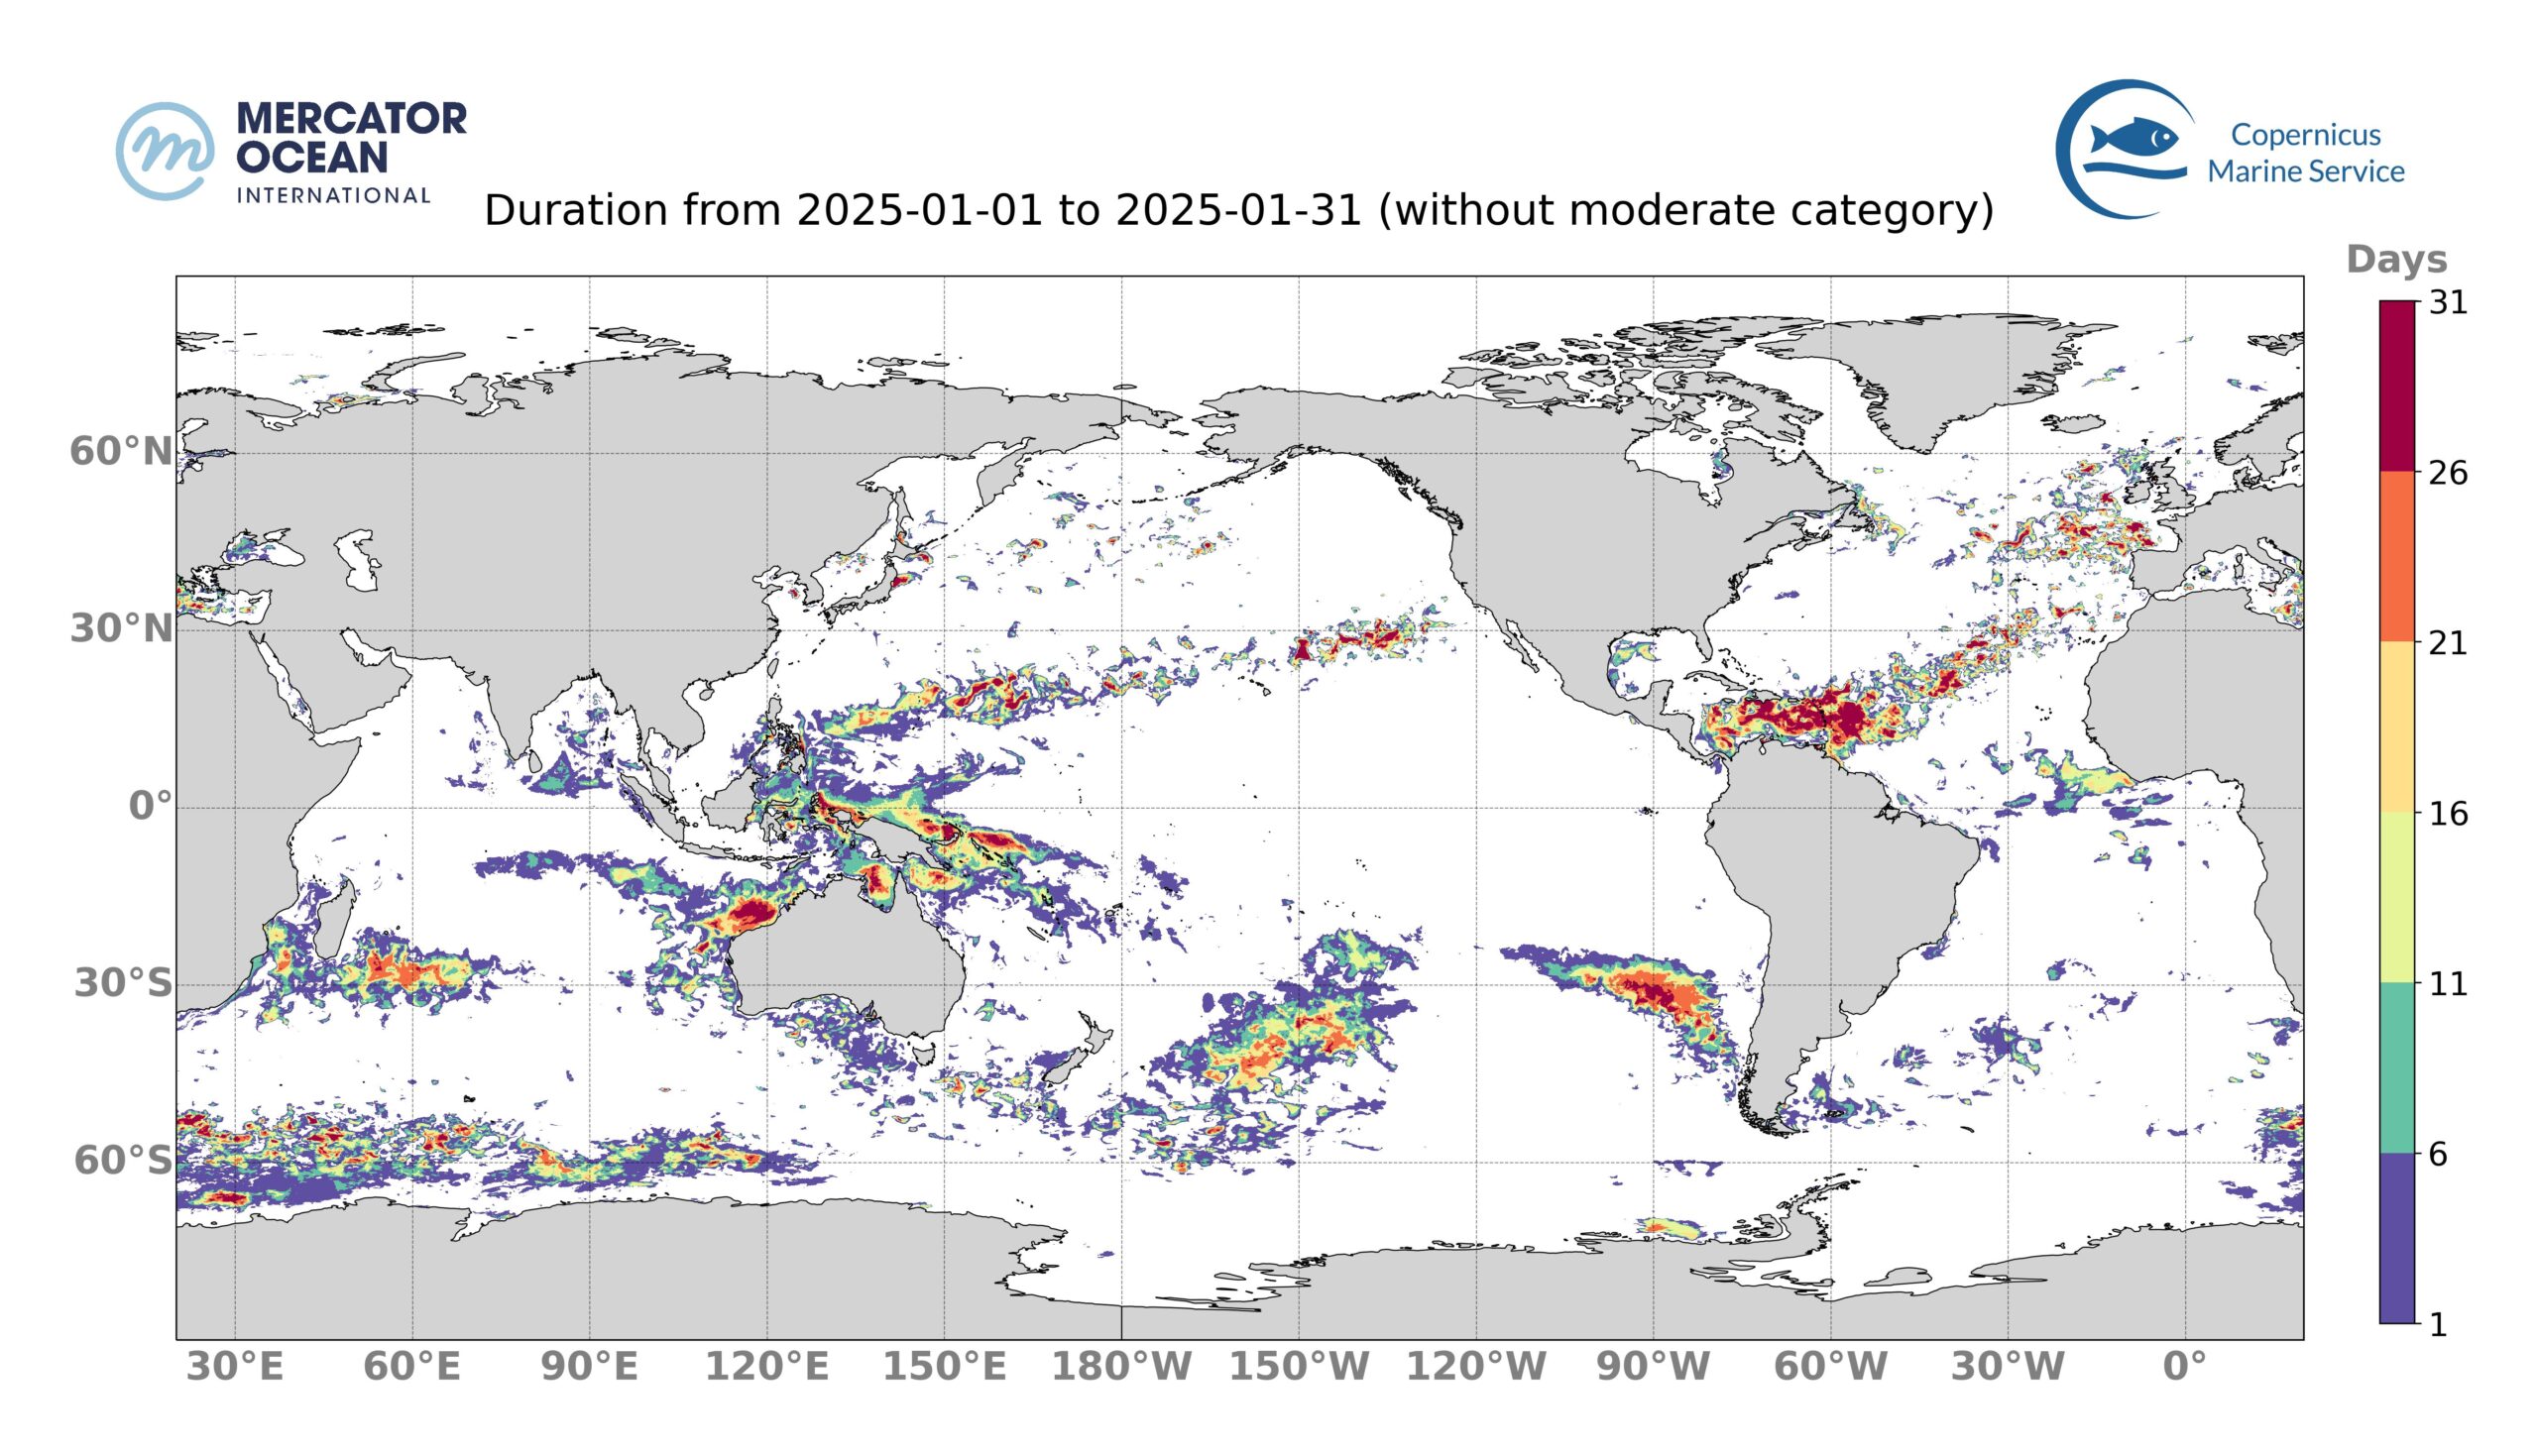
The surface of the ocean impacted by strong, or higher, MHW conditions for at least 1 day is 18.8 %. The impacted regions are mainly the Caribbean Sea, the southeast Asia region (north of Australia), and the southern Pacific off New Zeeland and off Chili.
Figure 6: January 2025 MHW days of strong and higher category. Number of days during which a MHW of category strong, severe or extreme occurred in January 2025. Blank areas mean that no MHW of strong or higher category happened during the month.
January Statistics
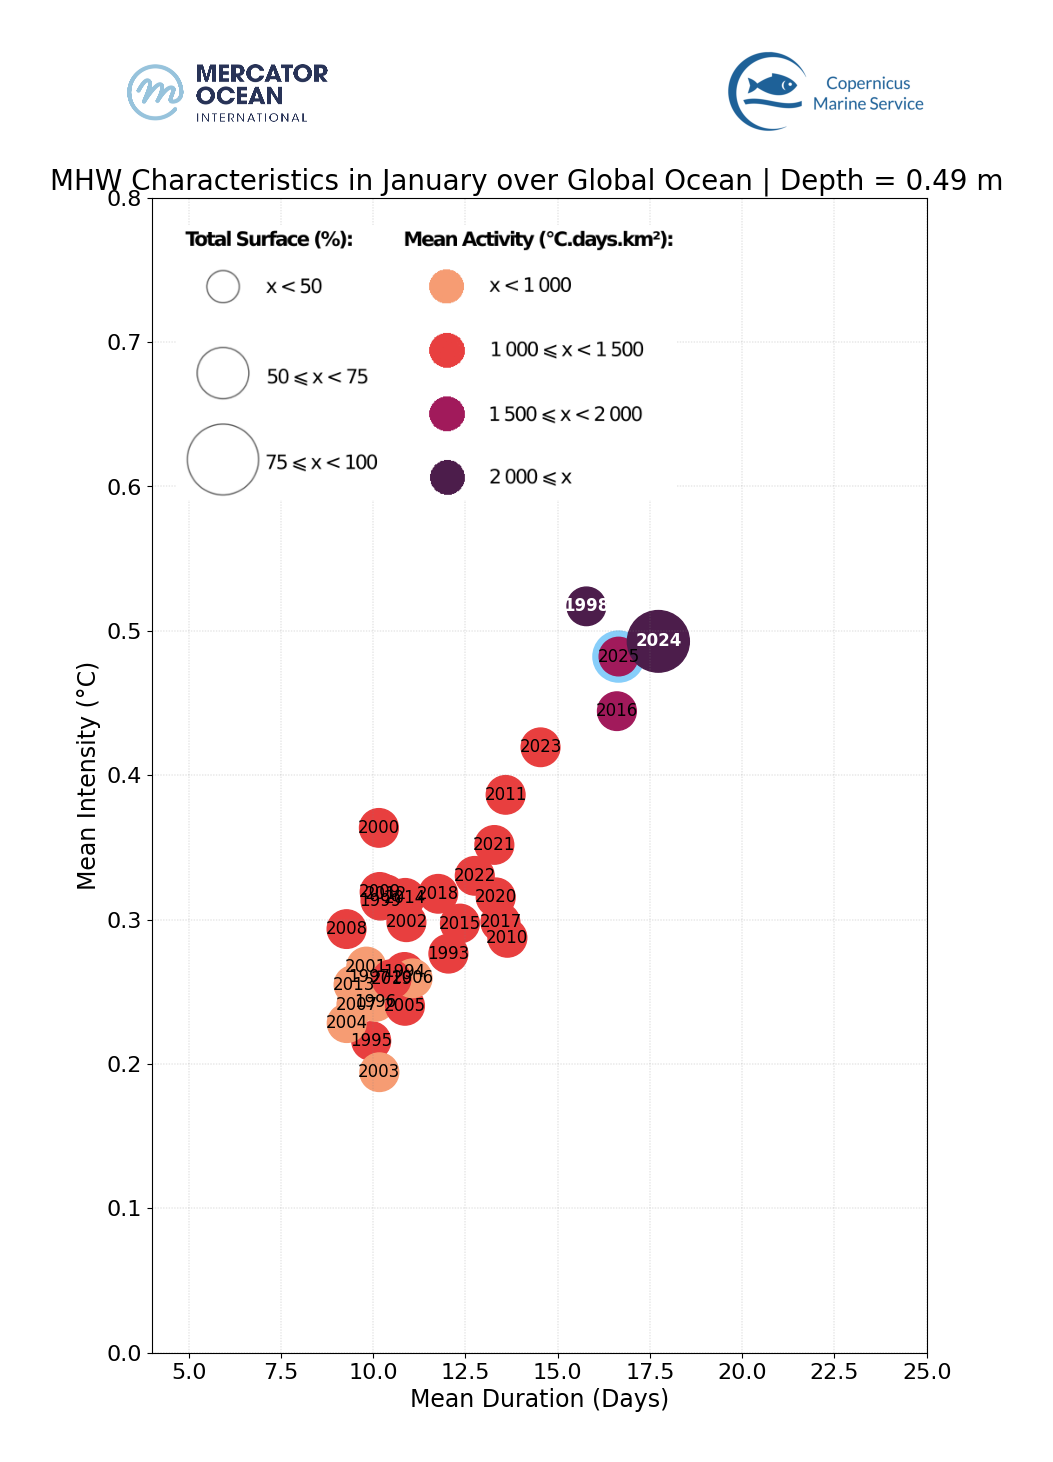
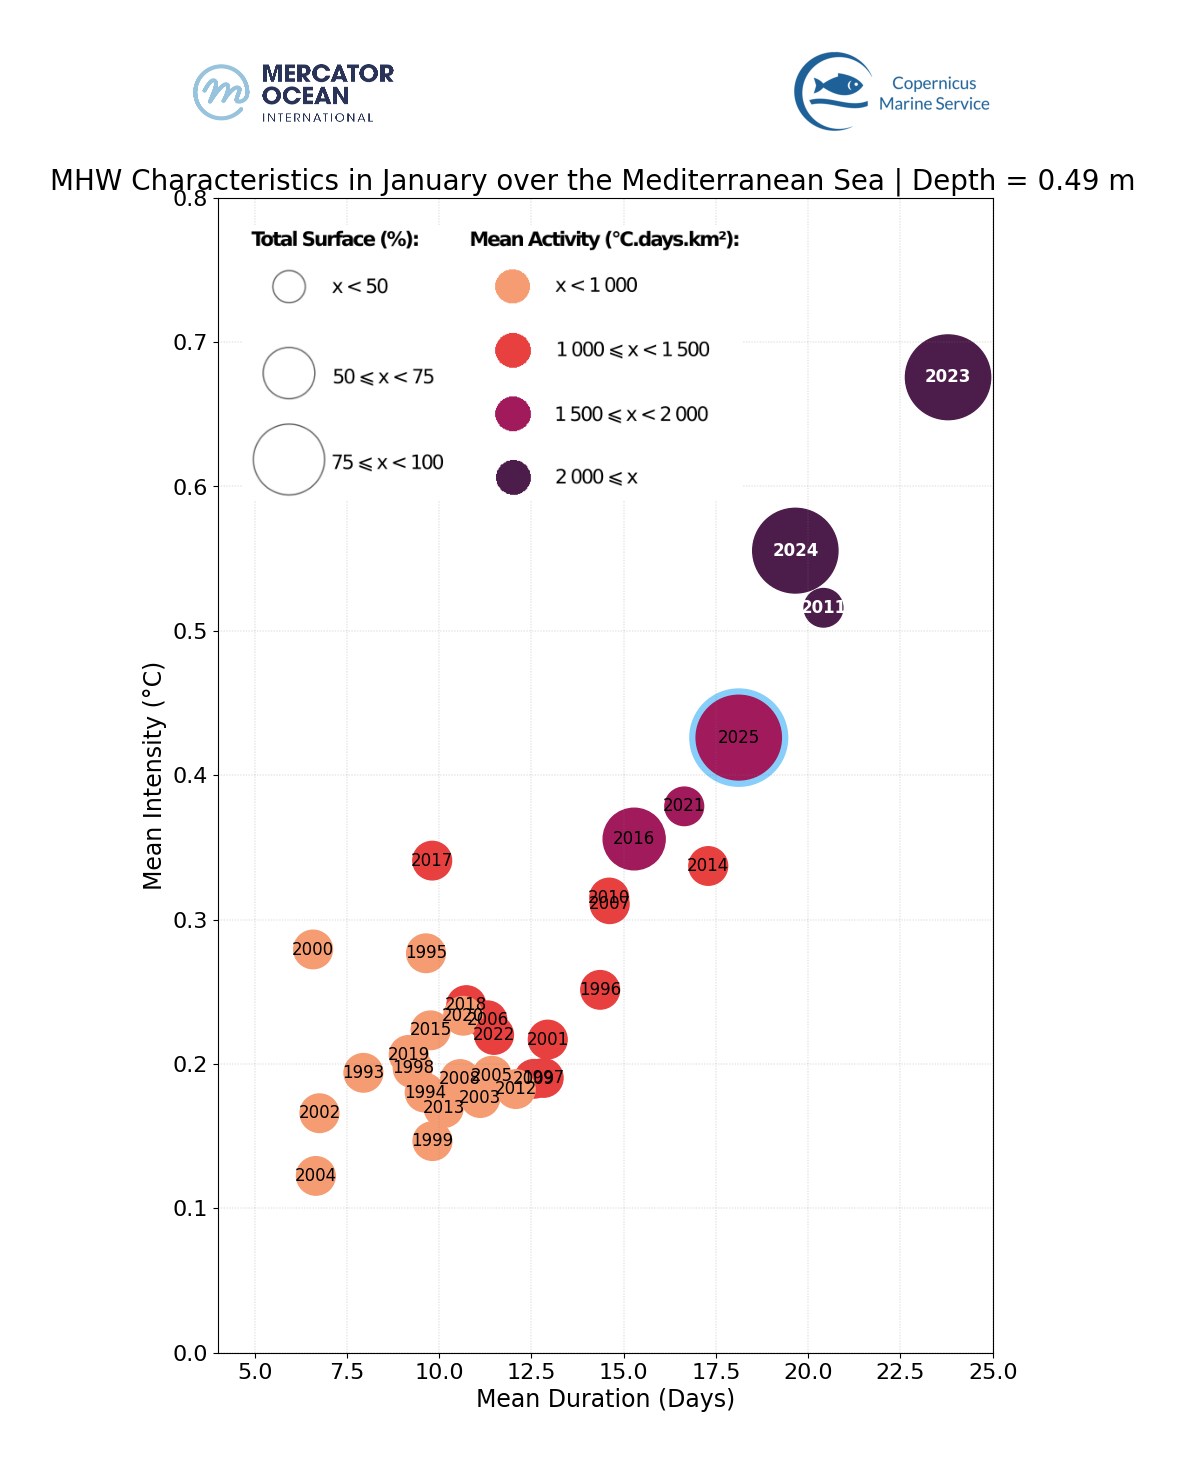
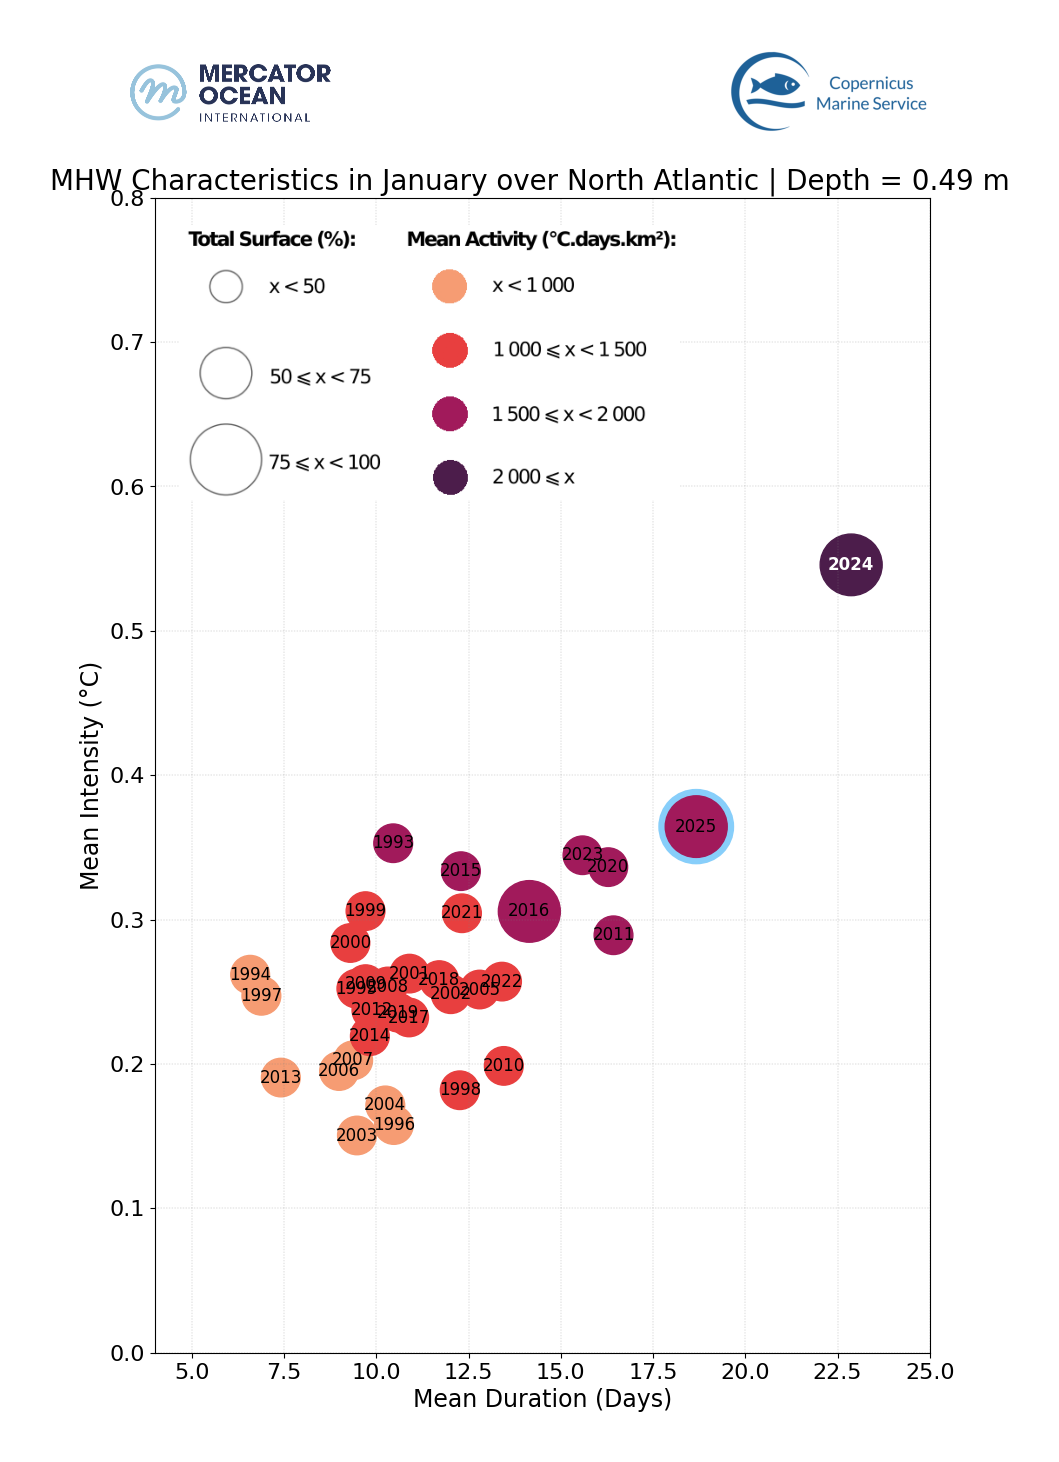
Figure 7: MHW characteristics for January months from 1993 to 2025. Duration, intensity, extent and activity averaged for each January month between 1993 and 2025 for the global ocean (left), for the Mediterranean Sea (centre) and the North Atlantic Ocean (right). January 2025 is highlighted with a blue edge.
The MHW statistics (duration, intensity, surface occupied and activity) for January 2025 are compared to those for January months from previous years (since 1993).
- On a global scale, January 2025 is the 3rd most extreme January month in terms of MHW after 1998 (more intense) and 2024 (wider extent and longer). MHWs of January 2025 exhibit similar characteristics to those of January 2016 but with a greater intensity.
- In the Mediterranean Sea, January 2025 was the 4th most extreme January in terms of MHWs, after 2011, 2024 and 2023.
- In the North Atlantic, January 2025 was the 2nd most extreme January month, only January 2024 was more extreme.
About the bulletin
Mercator Ocean International (MOi) publishes a monthly sea surface temperature bulletin reporting on mean temperature and marine heatwave conditions for the month just passed. It includes:
- Regions where MHWs are present and the time these events started,
- Timeseries showing the total surface occupied by MHWs globally and for the European region,
- The total number of days of exposure to MHW during the month (including only strong and higher intensity categories).
The results are obtained using the Copernicus Marine Service global analysis system at 1/12° of resolution.
Image citation: European Union, Copernicus Marine Service Data 2024 I © Mercator Ocean
All images in this article can be used freely and should be cited with the information above.