
Key take-aways
- Sea ice cover in the Antarctic has reached its annual minimum extent on the 20th of February, 20% below the long-term average (1993-2010).
- Sea Ice volume is currently at 1.18 thousand km³, 47% lower the long-term average (1993-2010).
- February 2024 remains another year of low sea ice extent and volume for the Antarctic.
Sea Ice Extent
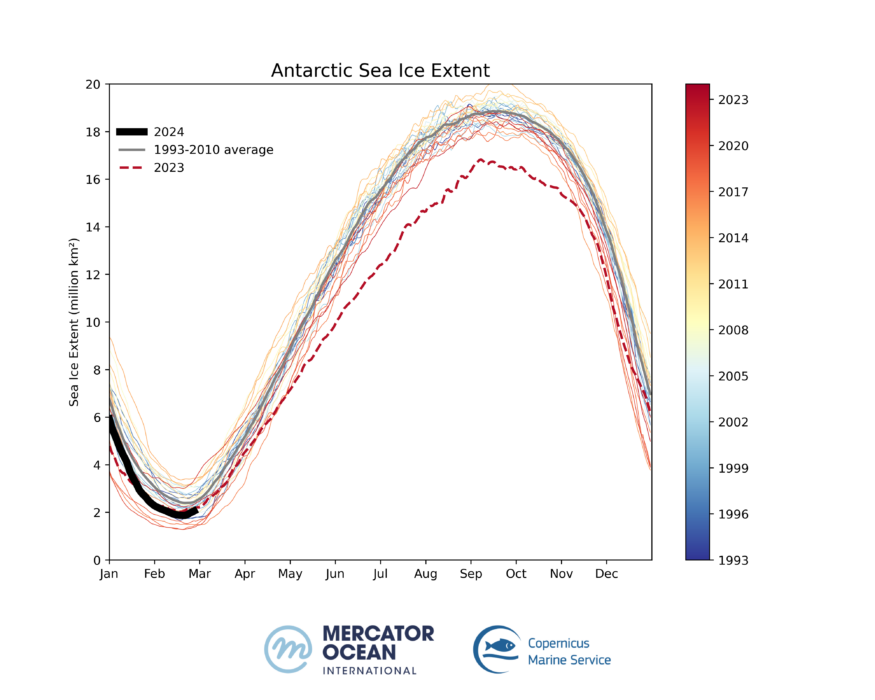
Figure 1: The 1993-2024 Antarctic daily sea ice extent. Global 1/12° forecasting and reanalysis systems. Source: European Union, Copernicus Marine Service Data 2024 I © Mercator Ocean
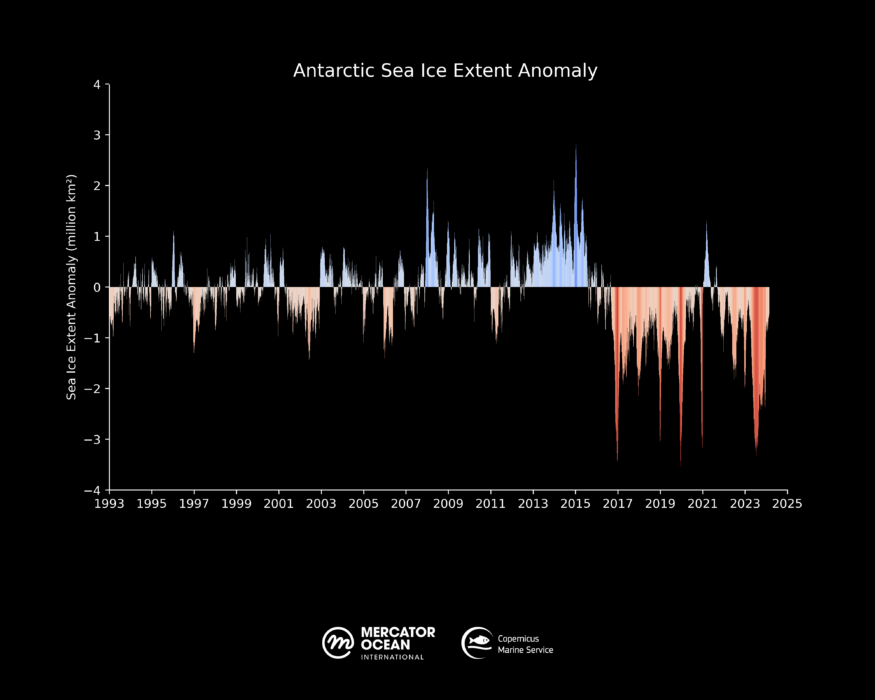
Figure 2: The 1993-2024 Antarctic Sea ice extent daily anomaly (using 1993-2010 climatology). Global 1/12° forecasting and reanalysis systems. Source: European Union, Copernicus Marine Service Data 2024 I © Mercator Ocean
Antarctic sea ice cover has reached its annual minimum extent of 1.86 million km² on the 20th of February 2024. This represents a loss of 0.49 million km² compared to the 1993-2010 long term average (2.36 million km²), or 20% less the same period. February 2024 shows another exceptional low extent (after the record-low in February 2023, since satellite record).
Sea Ice Concentration
On the 20th of February 2024, the Antarctic Sea ice concentration (figure 2 red line) was noticeably below the long-term average between 1993 and 2010 (figure 2 black line) for the same date in the year. Compared to the 1993-2010 period, large areas of sea ice cover are missing in the Atlantic and Pacific sectors (figure 1).
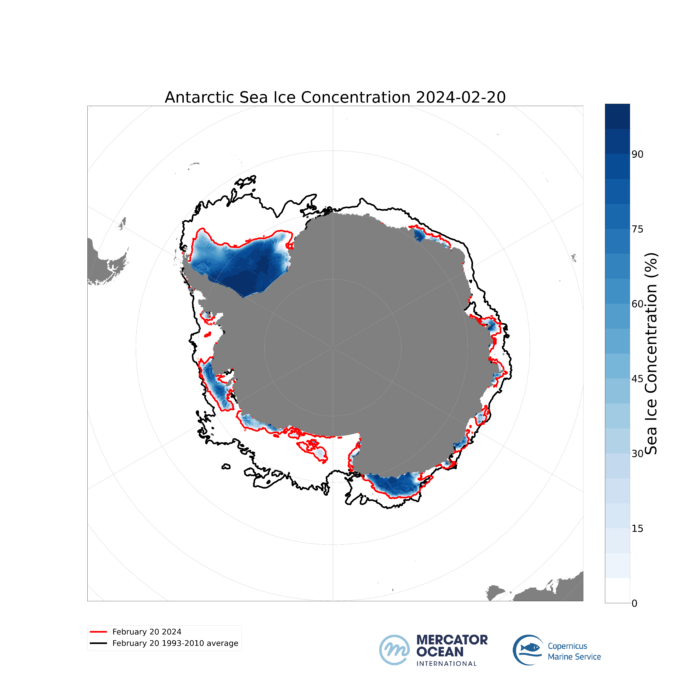
Figure 3: Antarctic Sea ice concentration (red) for 20th February 2024. The black line represents the 1993-2010 average (climatology) for the same date in the year. Global 1/12° forecasting (Lellouche, 2018) and reanalysis (Lellouche, 2022). Source: European Union, Copernicus Marine Service Data 2024 I © Mercator Ocean
Sea Ice Volume
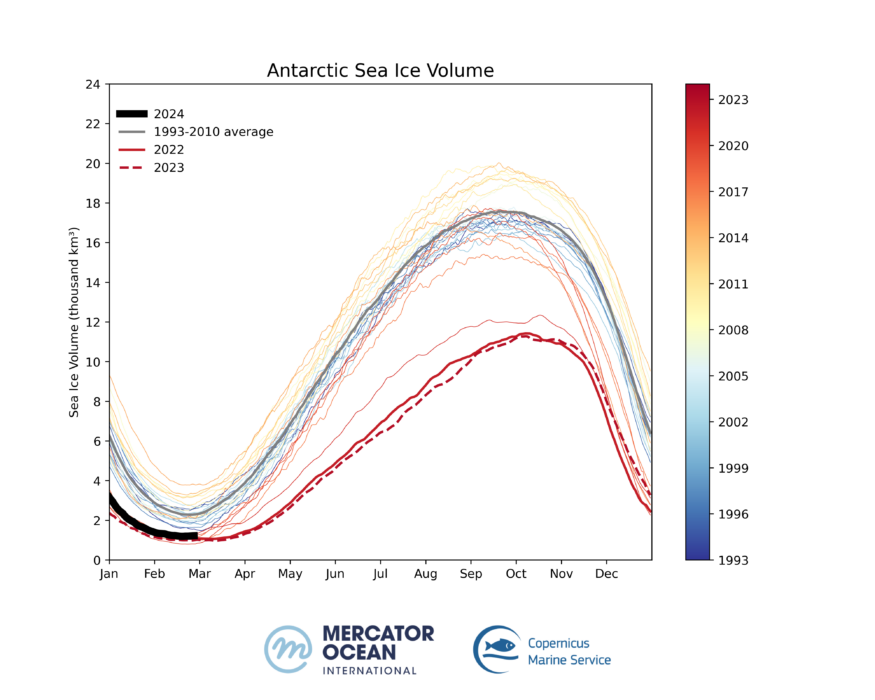
The Antarctic sea ice volume has reached of 1.18 thousand km³ on the 20th of February 2024. This represents a loss of 1.05 thousand km³ compared to the 1993-2010 long term average (2.24 thousand km3), or the equivalent to a 47% loss in sea ice volume. In the last two years, minimum sea ice volume in the Antarctic was 50% below the 1993-2020 yearly minimum average.
Antarctic Sea Ice Volume trend
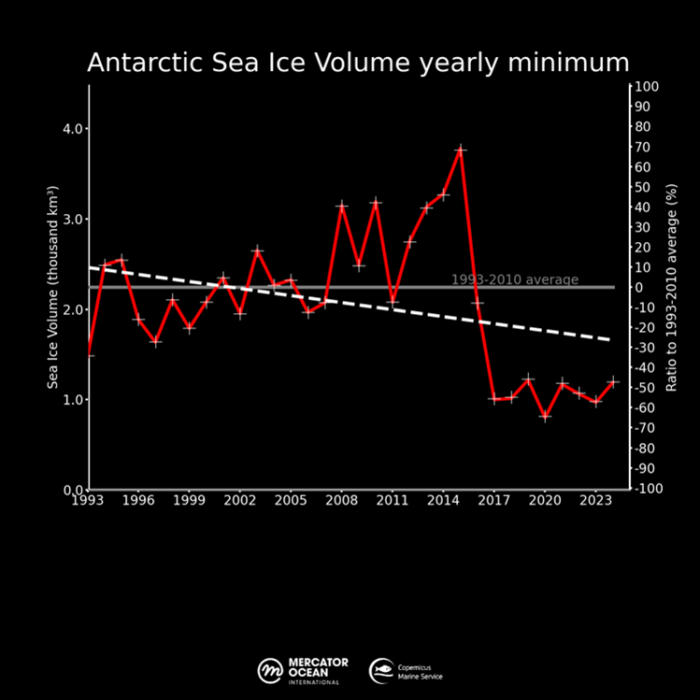
After nearly 30 years of a highly variable sea ice cover in the Antarctic region throughout the year, and therefore no clear trend, the last few years have shown a slight negative trend, particularly when considering the annual minimum value (measured in February). The 1993-2024 trend (figure 6) represents a loss of 0.25 thousand km³ per decade.
Monitoring the sea ice cover in this period of the year is crucial because it represents the annual minimum sea ice coverage in the Antarctic. These measurements provide a vital indicator on the changes happening every year, as they serve as a reference for seasonal contrasts in sea ice cover.
Definitions:
- Sea ice extent – area covered by a significant amount of sea ice, at least 15% sea ice concentration (km²).
- Sea ice concentration – percentage of sea ice cover within the data grid cell.
Notes:
This Mercator Ocean bulletin was developed by Clement Bricaud, Gilles Garric, Andreia Ferreira de Carvalho and Gratianne Quade.
Products and data used: GLORYS12V1 global ocean eddy-resolving (1/12° horizontal resolution, 50 vertical levels) reanalysis covering the altimetry (1993 onward). https://doi.org/10.48670/moi-00021
The Operational Mercator global ocean analysis and forecast system at 1/12 degree. https://doi.org/10.48670/moi-00016
References:
Lellouche, J.-M., Greiner, E., Bourdallé-Badie, R., Garric, G., Melet, A., Drévillon, M., Bricaud C., Hamon, M., Le Galloudec, O., Regnier, C., Candela, T., Testut, C.-E., Gasparin, F., Ruggiero, G., Benkiran, M., Drillet, Y., Le Traon, P.-Y. (2021) The Copernicus Global 1/12° Oceanic and Sea Ice GLORYS12 Reanalysis. Front. Earth Sci. 9:698876. doi: 10.3389/feart.2021.698876
Lellouche, J.-M., Greiner, E., Le Galloudec, O., Garric, G., Regnier, C., Drevillon, M., Benkiran, M., Testut, C.-E., Bourdalle-Badie, R., Gasparin, F., Hernandez, O., Levier, B., Drillet, Y., Remy, E., and Le Traon, P.-Y.: Recent updates to the Copernicus Marine Service global ocean monitoring and forecasting real-time 1∕12° high-resolution system, Ocean Sci., 14, 1093–1126, https://doi.org/10.5194/os-14-1093-2018, 2018.
More on the topic:
Antarctic Sea Ice Reaches Lows Never Before Observed – Mercator Ocean (mercator-ocean.eu)